Best Thread Potential setups

Status
Not open for further replies.
A while ago when ftse was rallying, i got an entry that wasnt even on the charts yet. Only the once, I'm going to run it back up again.

Hopefully they aren't trying to **** you over.

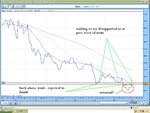
Sterling is fantastic today, really easy to read.

Goodluck all.

against dollar?

i want to look. i need to learn.
 
This.

Sterling against everything right now.
Update. I'm offski, I'll write something on my journal to show you what I was looking at.
 

Attachments

  • fgsfgsdfgdfsgdfFAGasdfasda.jpg
    fgsfgsdfgdfsgdfFAGasdfasda.jpg
    95 KB · Views: 167
Heads up.
UsdNok isnt too far from it's 5month range lows.
Worth watching for price action.
 
It seems a little dull being back at work and having to trade the 4hr charts and above :-(
Still, maybe it will fit better with me and my equity curve. That way one only takes the very best moves; trouble is 1hr pins do give way to some excellent trades. I guess I will have to wait for the retrace to show on the 4hr and get back in.

At least with 4hr you check at 0800 (arrving at work), 1200(lunch) and 1600(just before leaving!)

Tom, thanks for the info regarding ProRealTime - Is there a way of loading up all the charts at once or do you have to click on each one and wait for it to open? With Sharescope I can just scroll thru the FTSE 350 looking for set ups in a matter of minutes. It would take hours on ProRealTime would it not? Unless I'm missing a trick and being 'dim'?
Cheers
Grim
 
Tom, thanks for the info regarding ProRealTime - Is there a way of loading up all the charts at once or do you have to click on each one and wait for it to open? With Sharescope I can just scroll thru the FTSE 350 looking for set ups in a matter of minutes. It would take hours on ProRealTime would it not? Unless I'm missing a trick and being 'dim'?

Hello mate, I know you can do it but no idea how!
 
Can someone tell me if I'm talking sh*t here please. This is how I'm looking at things at the mo.

Could be a good reverse h&S pattern there are the bottom; depends on your view really. The pattern may suck a few people in long on the break of the neckline and then reverse and continue the down trend possibly?

Look at the wider index too for clues. Have a look at some of the individual bank share charts and then see how they measure up technically. I'm not sure I'd trade a sector index, more use it as a yardstick to find good charts within the sector and play them? Only my opinion as I don't often trade shares.

Personaly I'd wait for a breakout then a retrace and if it puts in a higher low then maybe a chance to jump on board.
 
@grim
Im not really looking to trade it I'm just trying to understand the charts.
I was basically thinking the same thing about the down trend continuing.

As for the use sector to find trades in shares - opened a new dimension for me lol.

Nice to know I'm actually learning something.
You just gave me a bit more terminology too. Easier to translate my thoughts to you lot if I use the right terms.

Merci mon frere (y)
 
SMI has gone up more in percentage terms, was a great trade that, I remember your post as I was looking at taking it but thought I had too much exposure on the long side.

Goose... are you cheating mate :cheesy: ?

Simply look at TD's trades using your special S&L admin access and then simply
copy them :LOL::LOL:
 
Is there a way of loading up all the charts at once or do you have to click on each one and wait for it to open? With Sharescope I can just scroll thru the FTSE 350 looking for set ups in a matter of minutes. It would take hours on ProRealTime would it not? Unless I'm missing a trick and being 'dim'?
Cheers
Grim

With IG index who use ProRealTime, load up all your charts and arrange them until u are happy. Goto Templates->Save
Now every time u select your saved template all your charts will load up. Useful to have a weekly/daily/4hr/1hr template to load up all the charts and scan them quick time. ;)
 
Goose... are you cheating mate :cheesy: ?

Simply look at TD's trades using your special S&L admin access and then simply
copy them :LOL::LOL:

I'm a professional mate, would never do that (will give you the heads up on the next one, wink wink)

Phil, know what you mean about cable today, but normally find it the strangest market. Must have asked for info at the top, which I thought was a level but thought for once it might go 300+ up in the day. Whenever you see cable up over 200 by midday, sell it.
 
Goose... are you cheating mate :cheesy: ?

Simply look at TD's trades using your special S&L admin access and then simply
copy them :LOL::LOL:

Copy them? Fade them more like!! I did my ars* on S&L. Then got the £100 refund, then did my ars* again.

I've pretty much sold the Bund at every overhead resistance.

I'm convinced it is going to tank but it's a difficult one. It likes to grind and squeeze.
 
Copy them? Fade them more like!! I did my ars* on S&L. Then got the £100 refund, then did my ars* again.

I've pretty much sold the Bund at every overhead resistance.

I'm convinced it is going to tank but it's a difficult one. It likes to grind and squeeze.

See, i'm that professional, I didn't even reveal the truth

I was trying to add rep points for you revealing that but apparently I have to spread the love around first!
so someone add a nice graph on a major index or currency pair
 
Eurusd

I was trying to add rep points for you revealing that but apparently I have to spread the love around first!
so someone add a nice graph on a major index or currency pair

Did someone say free love?
Here is a nice chart for you Mr Goose. The hourly is tasty too off the 38.2 fib.
 

Attachments

  • eurusd 4.gif
    eurusd 4.gif
    24.2 KB · Views: 196
With IG index who use ProRealTime, load up all your charts and arrange them until u are happy. Goto Templates->Save
Now every time u select your saved template all your charts will load up. Useful to have a weekly/daily/4hr/1hr template to load up all the charts and scan them quick time. ;)

I knew I was being Dim; thanks Rags. Typical bloke in that I never read the instruction manual and dive in!! I shall have fun with that at the weekend. I've been loading up individual charts each time and it was taking ages! I had the template saved but I didn't realise it applied to all the charts you may have open at the time.
Thanks again!

Nic,
Nice charts btw. Nice and clean with no 'squiggly lines'; that'll keep Strat happy!!
 
Chart discrepancies

This.

Sterling against everything right now.
Update. I'm offski, I'll write something on my journal to show you what I was looking at.

I puzzled for a while over why cable had hit the bottom of your trendline (first thumbnail - was attached to your post), but not of mine (second thumbnail). The answer seems to be that I have data for the couple of hours of late Sunday trading on mine, and it is missing on yours which presumably restarted after the weekend at midnight. So which is the "real" trendline"!?
 

Attachments

  • fgsfgsdfgdfsgdfFAGasdfasda.jpg
    fgsfgsdfgdfsgdfFAGasdfasda.jpg
    95 KB · Views: 140
  • gbpusd mt4  090316.gif
    gbpusd mt4 090316.gif
    12.4 KB · Views: 139
I think your chart is correct after looking at a different provider. I'll check IG next, just going through all the different IT finance charts i have. This new package i'm using has 2h 4h extra which is why I'm using it. I guess it was a fluke that it hit.

However, I really don't like metatraders charts, they seem to either go too far or not reach the area on the same markets on it finance. Can be a real **** sometimes.

Will look into this further.
 
Status
Not open for further replies.
Top