trader_dante
Veteren member
- Messages
- 4,535
- Likes
- 1,704
Hey, here is something I like to do that may help some of you guys increase your risk: reward ratio on a trade and actually nail the turning point.
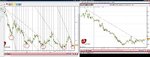
First step is to find the high probability turning points on the chart as I have shown in the Making Money Trading thread. Then what you can do is trail a stop entry order above or below the price so you get in on the first initial reaction.
You allow yourself a fixed ratio of pips to measure the rejection based on the volatility of the pair, the strength of your own analysis (based on experience) and the amount of confirmation you desire and trail your stop accordingly.
But something I like to do to take this up a notch is combine this with the concept of time. So if its possible that a rejection is enough of the way through the hour to make a bearish setup on the hourly then I will enter or prepare to run it for longer. If it is not then I will either miss it or look for a very quick trade.
I hope that some of you will understand that. Its quite an abstract concept and I'm not sure I've explained it well.
-Tom