glyder
Established member
- Messages
- 755
- Likes
- 94
nope he said he dont trade dow anymore
you can load up on other things too...don't have to be dow.
nope he said he dont trade dow anymore
anyways, I don;t really think thats what happened.you can load up on other things too...don't have to be dow.
I don't like it.
(Hi everyone, I'm new. Just started trading a few weeks ago)
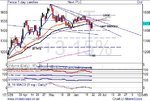
whats everything think of this setup?
WOw look at cable
fade it fade it fade it
Without wishing to sound like a complete Neanderthal, what is fading? Is it a well know term in trading or just T2W talk? I wouldn't be surprised if I do fade things but I just wouldn't know I was at the time 🙂
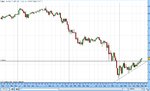
Hi guys Im pretty new to these boards but looking for some feed back on a trade Im in
On thursday I shorted nxt .Entry was 1447 r\r is 119-260 Just above 2-1
on the thursday made 21 points then on friday retraced back to neck line
while it was retracing to neckline I hedged myself by going long the ftse and when it was back at at the neckline I also loaded my position on nxt and so now the stage is set for monday and mu question is this
1) should I move my stop to just above the confluence lines (shown in red on the chart)
at level 1506 to 1509 or stay above right shoulder ?
2) whats your thoughts on my tactics on this ,
1) you should move your stop to minimize your risk, you have loaded up and are carrying more stock, so you should adjust your SL to take into account the % of your account at risk, in accordance with your money management criteria.
2) from what I can see, a two bar reversal has developed (last two bars), at a support level, this is a bullish indicator and it is more likely your stop will get hit before your target, that neckline you have drawn is weak, the market plays out a continuation pattern more than it reverses, and this market has been in a longer term uptrend from what i can see from your chart.
in my personal opinion, this trade is going to be a losing one if you leave things as they are.
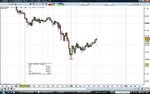
GBP CHF Weekly pin just bounced off a retest of pivot zone. looks lke plenty of space up above.
a trade with the trend.
I'll wait see if a good entry point on a retrace shows itself during next week.
GBP CHF Weekly pin just bounced off a retest of pivot zone. looks lke plenty of space up above.
a trade with the trend.
I'll wait see if a good entry point on a retrace shows itself during next week.
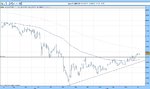
Hi,
I don't really do these types of trades, so I am sure you know more about these than me.
But there does seem to be a bit of traffic to the left of this candle. If you compare it to the candle on week 02 Jan, you may see what I mean.
Kind regards
Jason