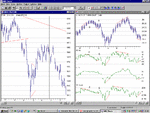
Perhaps it's worth a closer look at the UK market chart. Remember that this is an unweighted composite of the constituents of the Allshare, and is shown alongside the FTSE-100 cash. It's beginning to look interesting. Although the market chart has made new lows, these have not been confirmed by the Advance decline Indicator (AD Ind), VP trend and the Hi/Lo indicator. All 3 of these have started to rise, and are diverging from the trend of the UK Market chart, indicating that there may be underlying strength. These indicators have been relatively reliable in the past, and I used them to warn of the current correction on 25th May, shown by the solid vertical line on the above charts. This signal is being called a little prematurely, but it just might be indicating that a reversal is imminent. What is not clear is how large or how sustained any reversal may be. At the moment I am just using this as a "frame of mind" indicator, and I'm prepared to turn bullish rather than perpetuate the bearish mantra!
Similar threads
- Article
Technical Analysis
Measuring Stock Market Sentiment With Extreme Indicators

