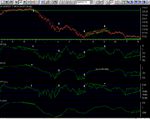
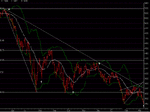
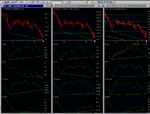
Whist we all seem to be wedded to the concept that this market is going down in the medium term, we should not be blind to possible turning points in the short term which may be helpful from the point of view of timing short entry and exit points.
And the FTSE seems to be indicating that a short term bottom may be in place soon. There is divergence between 4 market breadth indicators and the market timing price chart. This is an unweighted composite chart of the shares that have reliable volume and approximates to the shares that make up the
FTSE all share index. These indicators can sometimes diverge to indicate a turn rather early, so it always pays to wait until price confirms the divergence, and this has not yet happened. Never-the-less, in the past it would rarely have been profitable to take a contrary view to the indication provided by this set of indicators, particularly when they are all pointing in the same direction, as now. We are very close to the Jan (cash) low of
3492 which may provide short term support.
We need to see a higher close to confirm the signal!!!!!!
Whether any bounce will be meaningful or tradeable in anything other than the very short term (intraday) there is no way of telling. Given that it has kicked in early in the past, whether it has any relevance for the March futures/options expiry is also debateable, but I merely draw it to your attention!
Attachments
Last edited:


