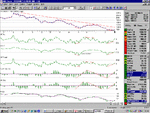
Encouraged by the use of market breadth data to call a turn in the main market I have applied the same criteria to the techmark. The chart posted below is a bit "busy", but the same principles apply.
I have created an unweighted composite chart made up of all the shares in the main techmark index. That is the top chart. Below it are 6 market breadth indicators that are all pointing to a reversal. In each case the indicator has diverged from the (top) price chart. In particular it is encouraging to see that this potential reversal is confirmed by the Hi/Lo indicator which was not the case in the previous "false dawns" that we have been plagued with.
The main set are the AD indicator, HI/LO indicator and VP Trend. The first 2 are only available on the market timing charts, and signals are generated by divergence between the indicator and the price. Of these, the AD
indicator is the most powerful, the other 2 are part of the supporting cast.
The second set are Up/Down Osc, P-Vol and AD Osc
Sometimes the HI/LO indicator doesn't confirm.
A useful additional confirmation comes from the second set of indicators, Up/Down osc, P-Vol and AD Osc. When the 2 Oscillators cross up thru 0 *AND* P-vol is rising and above its moving average (purple), it is a confirmed buy. Likewise, when the 2 Oscillators cross down thru 0, *AND* P-Vol falls below its MA, then it is a confirmed sell. This second set of indicators tends to set in a little later than the warnings given by the first set, but when both sets are singing off the same hymn sheet, it does seem to be a powerful message.
Anyway, I'm still getting to grips with the use of this set of indicators on a market timing chart of the Techmark constituents so make up your own minds. But there does seem to be more substance behind the current rally. Look at AEA, Anite, ARM, Logica and Pace to name just a few.
Regards,