I found the following application on another platform ( NT ) , and would love to have this implemented and coded for TorS , since it is the platform that I use for trading
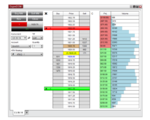
I think that it could really help , in giving us a visual in the sense that ..... Say we only want to risk $200 per trade
By having this PnL " DOM " next to the Active Trader DOM , we could see at what price level that $200 risk would be, and then transfer that information by looking at are chart(s) and seeing if by placing are stop at this $200 max risk " Price Level " is AT, above or below a key support level for example, if we're going Long a trade
Also, we could use this visual information of the PnL associated with each price level, in knowing if different price levels, coincide with are preferred reward to risk ratio ( risking $200 and are target(s) at $400 and or $600 ) for a 1:2 and 1:3 R/R
Also, we can use this information, to see if certain Fib. extension levels / profit targets are within the Symbol that we're trading's ADR " range " ..... as we don't want to suspect that we can get say80 ticks out of CL during a given trading day, if the ATR is only 50 ticks ( using an Indicator like the OHLC ATR , using calculations from CL's current day, 10 day and 20 day ATR calculations )
I really appreciate any and all help
Hope there's a way that this can be coded for TorS, as I feel it will be a huge advantage to all TorS users
I appreciate any and all help and input