You are using an out of date browser. It may not display this or other websites correctly.
You should upgrade or use an alternative browser.
You should upgrade or use an alternative browser.
Noxa indicators for Neuroshell
- Thread starter val2004
- Start date
- Watchers 71
I
ilya_v
hi arryex
I want to ask you a private message, but I can not do it (limit 15 posts)
please send you email to me private message or me email
I want to ask you a private message, but I can not do it (limit 15 posts)
please send you email to me private message or me email
Anyone who wanna try Change Point Detection, can download from this link (its free) Change-Point Detection
it use SSA algortihme...
it use SSA algortihme...
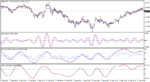
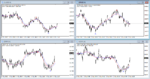
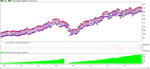
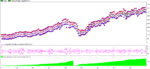
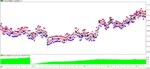
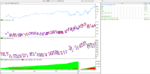
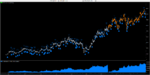
Trading strategy generated..
good offline but not sure on real..
good offline but not sure on real..
Attachments
-
 Trading Strategy singularPCA1.png33.9 KB · Views: 966
 -
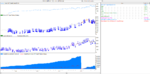
 Trading Strategy singularPCA2.png50.4 KB · Views: 787
 -
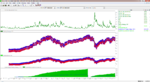
 Trading Strategy singularPCA3.png51.2 KB · Views: 623
 -
 Trading Strategy singularPCA on GBPUSD.png53.5 KB · Views: 614
 -
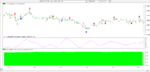 Trading Strategy singularPCA on GBPUSD 1M detail.png29 KB · Views: 815
Hi arryex,
We have excanged IMs in the past and is great to see the progress you have made with NS and Noxa.
Thanks for your contribution to the forum!
I wonder if you have taken a look at the new Noxa product "AME".
cheers and happy holiday seasson to all,
Dan.
We have excanged IMs in the past and is great to see the progress you have made with NS and Noxa.
Thanks for your contribution to the forum!
I wonder if you have taken a look at the new Noxa product "AME".
cheers and happy holiday seasson to all,
Dan.
Hi Dan,
Nice to see your return to this forum.
I have checked, there are several tricky things inside Noxa-AME expert:
- We can show all equities for each AME setting (all windows values between 2 to 150)
- Setting the negative flag for the equity goes to negative direction
Then select use the parameter value which giving better equity for your trading strategy input, hence we can't sure whether the future equity will giving the same result except by doing the real out of sample testing.
One missing point with AME is no equity smoothing (just take what you get only).
To be frank it is easier than Noxa-CSSA, when implement using Neuroshell Trading strategy optimization.
Probably I should find a way how to smooth the equity using this AME.
I wish to have AME as what I get on my fast singular indicator..:cheesy:
Happy holiday season for all..
Attachments
Last edited:
Hmm, i see.
Perhaps AME is only good for certain instruments then..
The SSA crosover strategy your are comparing AME to, is built in on CSSA or is something you have programed?
I am wondering how are your results in live trading with these strategies? Are you being able to be successful at it?
Cheers,
Dan.
Perhaps AME is only good for certain instruments then..
The SSA crosover strategy your are comparing AME to, is built in on CSSA or is something you have programed?
I am wondering how are your results in live trading with these strategies? Are you being able to be successful at it?
Cheers,
Dan.
Hi Dan,
Nice to see your return to this forum.
I have checked, there are several tricky things inside Noxa-AME expert:
- We can show all equities for each AME setting (all windows values between 2 to 150)
- Setting the negative flag for the equity goes to negative direction
Then select use the parameter value which giving better equity for your trading strategy input, hence we can't sure whether the future equity will giving the same result except by doing the real out of sample testing.
One missing point with AME is no equity smoothing (just take what you get only).
To be frank it is easier than Noxa-CSSA, when implement using Neuroshell Trading strategy optimization.
Probably I should find a way how to smooth the equity using this AME.
I wish to have AME as what I get on my fast singular indicator..:cheesy:
Happy holiday season for all..
Anyone who wanna try Change Point Detection, can download from this link (its free) Change-Point Detection
it use SSA algortihme...
Hi Arryex,
Have you tried caterpillar SSA method Time series analysis and forecasting, Caterpillar SSA method ? Do you know caterpillar SSA method different than the Change-Point Detection method?
Caterpillar SSA method was converted in MQL4(it is recalculating-repainting ) some time ago.
Hi Tovim,
You can see the detail description from the book "Analysis of Time Series Structure", Nina Gonyaldina et. al. There will be explained the methodology of SSA, SSA forecasting and detection of structural change. Here what i found during the study.
Basic SSA is useful to detect the trend of a time series, smoothing data, noise removal, seasonal harmonic extraction, cycles extraction (different frequencies), extraction periodicity (with different amplitude), evaluate time series structure (trend and periodicity). Using window length we create trajectory matrix, decompose them using singular value decomposition (SVD), and grouping them based on selected components. One thing to be highlighted is the SVD values will be changes at any time we add new data, since all eigen values and eigen vectors will change and depend on its data series, hence we can't expect that the result will not repaint. That is why ssa indicator is always repaint for any new data.
I already checked the ssa indicator available on MT4 has cover only basic ssa above, the missing part (available on caterpillar-ssa) is the forecasting future ssa values (using LRF) and the change point detection.
See the previous post that showing simple forecasting ssa, I made it using matlab, still develop to evaluate it for market data on NST using walk forward.
Hi Arryex
I have also been explored ssa, in R there is a nice package called "Rssa", see PDF attached
Can you share some more detail on your version of the SSA? Did you create them via your own formula, or via neural network/genetic algorithm? Because everything I've tried just repaint, you always have to forecast somehow the last 4/5 bars.
There is another nice package in R called "mFilter"
see code below:
library('mFilter')
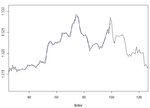
a = scan("C:/Mia/IBFX_1-Click/experts/files/EURUSD60_CLOSE.txt");
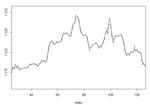
plot(a, type='l')
a.bw <- bkfilter(a, pl=2, pu=4, nfix=1,type="fixed")
a.trend <-a.bw$trend
lines(a.trend,col="blue")
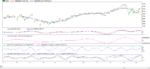
This filter is not repainting, but has a lag of 1 bar, see screenshots
I have also been explored ssa, in R there is a nice package called "Rssa", see PDF attached
Can you share some more detail on your version of the SSA? Did you create them via your own formula, or via neural network/genetic algorithm? Because everything I've tried just repaint, you always have to forecast somehow the last 4/5 bars.
There is another nice package in R called "mFilter"
see code below:
library('mFilter')
a = scan("C:/Mia/IBFX_1-Click/experts/files/EURUSD60_CLOSE.txt");
plot(a, type='l')
a.bw <- bkfilter(a, pl=2, pu=4, nfix=1,type="fixed")
a.trend <-a.bw$trend
lines(a.trend,col="blue")
This filter is not repainting, but has a lag of 1 bar, see screenshots
Attachments
Hi Superluz,
I never use R package, I should learn it first before can verify it. To avoid lag, you should add prediction next 1 bar of your filter (you can use NN or GA or forecasting using LRR).
Based on the residuals envelope, you may have also confident level of your prediction.
GA can help us to find the best parameter which mostly reflecting the data series structure, if it is lagging then you can predict the future bars using NN.
Hope above idea may useful for you..
Hi Superluz,
After reading I found that your mfilter consist of Baxter-King, Butterworth, Christiano-Fitzgerald, Hodrick-Prescott, Trigonometric regression filters. All those filters are available also on Matlab, I will check them out, few of them available here Matlab implementation of commonly used filters
Probably we can find them also on mq4 or c code.
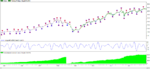
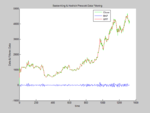
I found Baxter-King and Hodrick-Presscott on Matlab, HP is available on Neuroshell Trader but not recommended to be used as input trading strategy due to repainting. It is suggested to use HP Windows instead.
All matlab code, sample graph result on matlab and NST trading strategy using HP window are within zip file.
All matlab code, sample graph result on matlab and NST trading strategy using HP window are within zip file.
Attachments
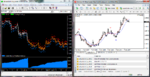
I am evaluating the signal generating from the SSA cross over, since the calculation is made using previous and ongoing close, probably in certain case signal repainting may occur. Then we just have two options: earlier signal with repainting or delay signal without repainting. I have another option to decide while manual trading.
Using indicator in NST the data feeding became crucial, if there is a problem while transferring data (example data jump due to lack of memory/CPU) from MT4 to NST then the calculation and signal generation will be bad. Using GA on NST is very useful to find the best indicator parameter setting to get best signal and showing equity.
The best way to insert indicator on MT4 itself, hence it will avoid any data feeding problem.
Current test configuration:
- Build dll indicator that applicable for both MT4 and NST
- Datafeed from MT4
- Use NST to find the best parameter setting and also verify the signal and equity
- Apply the parameter set on MT4
Attachments
Last edited:
Hi Ilya,
Check your email inbox
Thanks
Arry,
I would also like to discuss Mesa/Noxa strategies with you. Can you please also PM me your email.
Thanks,