You are using an out of date browser. It may not display this or other websites correctly.
You should upgrade or use an alternative browser.
You should upgrade or use an alternative browser.
Noxa indicators for Neuroshell
- Thread starter val2004
- Start date
- Watchers 71
amarozo
Newbie
- Messages
- 8
- Likes
- 0
Ooops the pictures are not clear for me, its difficult to read
please do take a look in mail
Hi Phepi,
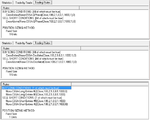
I verified your predictions input and outputs, the structure as below:
- Input is TProf4...of cluster8(...,Noxa CSSA LongEntry#0,...NoxaShort Entry #0)
- Output 4 bars prediction open
My comments:
- You are using Noxa CSSA with train bars =10000, in the mean time your chart has only 5335 bars, means you CSSA values will be changed anytime new data coming.
- Your OOS test is started on 10/05/2012 01:05, which is about at bar 4019. You should limit the parameter of CSSA train start and train bars, example if you set train bars = 500 then train start= 1 to 3520, 500+3520=4020 which is 4019 +1
- Please verify the value of Noxa CSSA Long and Short Entries for new bar data, is it change or not.
- Using cluster indicator is grouping the inputs into 2 group buy and sell -> its ok no issue, except the noxa inputs
- You use Tprof4 of OHL and Cluster8 data "to predict Close"
- Afterward you use Tprof to predict 4bars Open, I am not sure whether there is an impact to use predicted close to predict open.
Attachments
Last edited:
Hi Phepi,
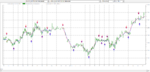
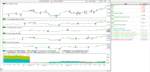
Please find here few screenshot for your chart compare to matlab modified ssa.
The ssa values is saved on eurusdlaladobressatrend.csv inside the zip. You may put the file in NST\Data folder, rescan your data then insert the value into your chart. I have made trading strategy and prediction strategy based on this ssa..
My next target is to make online calculation between matlab, NST and data feed... quite big job ???
Attachments
amarozo
Newbie
- Messages
- 8
- Likes
- 0
Hello Arry,
thank you very much for value comments, I need look out for range, with Noxa Showrange. And is true I have made a mistake 🙂 is not a great strategy if I am calculate close and then apply it to open
thank you very much for value comments, I need look out for range, with Noxa Showrange. And is true I have made a mistake 🙂 is not a great strategy if I am calculate close and then apply it to open
Hi Phepi,
I verified your predictions input and outputs, the structure as below:
- Input is TProf4...of cluster8(...,Noxa CSSA LongEntry#0,...NoxaShort Entry #0)
- Output 4 bars prediction open
My comments:
- You are using Noxa CSSA with train bars =10000, in the mean time your chart has only 5335 bars, means you CSSA values will be changed anytime new data coming.
- Your OOS test is started on 10/05/2012 01:05, which is about at bar 4019. You should limit the parameter of CSSA train start and train bars, example if you set train bars = 500 then train start= 1 to 3520, 500+3520=4020 which is 4019 +1
- Please verify the value of Noxa CSSA Long and Short Entries for new bar data, is it change or not.
- Using cluster indicator is grouping the inputs into 2 group buy and sell -> its ok no issue, except the noxa inputs
- You use Tprof4 of OHL and Cluster8 data "to predict Close"
- Afterward you use Tprof to predict 4bars Open, I am not sure whether there is an impact to use predicted close to predict open.
Hi Phepi,
Here I attached the chart with your original saved data and my ssa.
I verified that if you send the chart, it will retrieve the tpl (indicator template file), but if you do not have the dll, the indicator will not be shown.
Since ssa is done manually, it is not preferred for me to work on small time frame, except I already made them automatically...need time to learn to make it🙂
Attachments
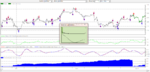
My current trick using CSSA:
- Display the chart
- Insert Showrange indicator to know how many bars available on chart, this is to define the value of trainstart and trainbars, where trainstart+trainsbars<available bars on chart
- Insert Showeigenvectors, find the values where the most trend are owned by data. Based on SSA explanation, SSA decomposed the data into several decomposed series, lower eigen value mostly for the main trend, other higher eigen values for other decomposed cycles which are more reflecting the noise.
- Create an indicator example cycle indicators with the preset of parameters based on above verification.
- Create a trading strategy based on cycle crossover, example cycle with lead parameter=1 with other cycle with lead=0 or with lag(cycle(...) indicator.
Attachments
Last edited:
amarozo
Newbie
- Messages
- 8
- Likes
- 0
thanks Arry a lot for great explanation <3 . It looks fine, just need have a patience learn how to set right cycles for Noxa CSSA addon.
My current trick using CSSA:
- Display the chart
- Insert Showrange indicator to know how many bars available on chart, this is to define the value of trainstart and trainbars, where trainstart+trainsbars<available bars on chart
- Insert Showeigenvectors, find the values where the most trend are owned by data. Based on SSA explanation, SSA decomposed the data into several decomposed series, lower eigen value mostly for the main trend, other higher eigen values for other decomposed cycles which are more reflecting the noise.
- Create an indicator example cycle indicators with the preset of parameters based on above verification.
- Create a trading strategy based on cycle crossover, example cycle with lead parameter=1 with other cycle with lead=0 or with lag(cycle(...) indicator.
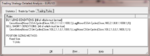
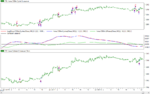
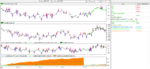
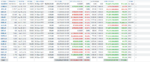
Here I build 6 trading strategies based on Noxa indicators, I compared with Hodrick-Prescot Window trading strategy.
You can see few of them are outperform compare to others..But this is a temporary result, if all are going bad means it's time to search for a new cycle and it indicates that the market cycle has been changed.
You can see few of them are outperform compare to others..But this is a temporary result, if all are going bad means it's time to search for a new cycle and it indicates that the market cycle has been changed.
Attachments
amarozo
Newbie
- Messages
- 8
- Likes
- 0
Hello Arry,
it looks interesting, can you please attach picture with inputs? :smart: Thanks a lot
it looks interesting, can you please attach picture with inputs? :smart: Thanks a lot
Here I build 6 trading strategies based on Noxa indicators, I compared with Hodrick-Prescot Window trading strategy.
You can see few of them are outperform compare to others..But this is a temporary result, if all are going bad means it's time to search for a new cycle and it indicates that the market cycle has been changed.
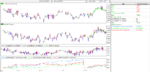
Hello Phepi,
The inputs are similar with the samples available on the help files..
But be careful, the market cycle is not static all the time, I am still searching how to detect this prior it happened, otherwise we left the equity become worst.
One thing that i figured, even noxa cycle and qphase have similar base but in actual the cycle cross over not always at the same time when qphase cross over zero. Probably this is an indication that the market cycle is start to change, and I should found another parameter and retrain.
Attachments
amarozo
Newbie
- Messages
- 8
- Likes
- 0
thank you for contribution 👍
Hello Phepi,
The inputs are similar with the samples available on the help files..
But be careful, the market cycle is not static all the time, I am still searching how to detect this prior it happened, otherwise we left the equity become worst.
One thing that i figured, even noxa cycle and qphase have similar base but in actual the cycle cross over not always at the same time when qphase cross over zero. Probably this is an indication that the market cycle is start to change, and I should found another parameter and retrain.
amarozo
Newbie
- Messages
- 8
- Likes
- 0
waaw this look's amazing, how are result on life trading? :-0
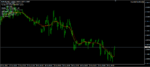
I found the SSA code on MT4, named as RSISSA then test the result on NST
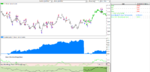
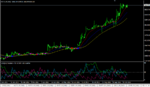
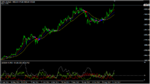
Here is my real account portfolio .. as I mentioned on my email..I am trading stock (investing actually). Here is few screenshot that I used as my trading strategy input..
Of course to trade on stock I do the fundamental analysis to the financial report, classify them using kohonen SOM (neuroshell, viscovery), verify the truth using Beneish M-score (find on google how it works to verify ENRON), technical analysis using neural network prediction, and psychology analysis...it works!!!
Of course to trade on stock I do the fundamental analysis to the financial report, classify them using kohonen SOM (neuroshell, viscovery), verify the truth using Beneish M-score (find on google how it works to verify ENRON), technical analysis using neural network prediction, and psychology analysis...it works!!!
Attachments
Last edited:
Hi Tovim,
Initially I choose basic and trigonometric functions but after Eureqa running, the best formula was made using basic function.
Based on my recent experience, for trending data series, I avoid polynomial, because it will power up significantly if you use the previous predicted values become input for the next predicted values.
For a free software, Eureqa is worth to try.
I found also GPTIPS, a similar free genetic algorithm implemented on matlab, I expect personally to expand its capability since all codes are open in Matlab.