Not exactly an indicator but,...

TheBramble

Legendary member
Messages
8,394
Likes
1,170
Does anyone else get a feel that for any given timeframe, there is a specific contraction of time along the x-axis which 'seems' more appropriate or more comfortable (sue me) for a non-logarithmic price scale on the Y-axis?

(That alone will probably ensure zero replies)...but to ensure complete silence...

Further...

In that 'comfortable' fit of X and Y - axes, does anyone notice how trends are dead easy to pot (i.e nail the end or at least the end of the real momentum phase) by using the 60 degree line connecting 'clearly visible and uninterrupted line-of-sight' lows on an up trend or highs on a down trend?
 
TheBramble said:
Does anyone else get a feel that for any given timeframe, there is a specific contraction of time along the x-axis which 'seems' more appropriate or more comfortable (sue me) for a non-logarithmic price scale on the Y-axis?

(That alone will probably ensure zero replies)...but to ensure complete silence...

Further...

In that 'comfortable' fit of X and Y - axes, does anyone notice how trends are dead easy to pot (i.e nail the end or at least the end of the real momentum phase) by using the 60 degree line connecting 'clearly visible and uninterrupted line-of-sight' lows on an up trend or highs on a down trend?
You been reading to many W.D.Gann books
 
A new Bramblometer is born...

We salute your benevolence in revealing this hitherto unknown treasure.....

PS Does it make a nice cup of tea?
 
TheBramble said:
Does anyone else get a feel that for any given timeframe, there is a specific contraction of time along the x-axis which 'seems' more appropriate or more comfortable (sue me) for a non-logarithmic price scale on the Y-axis?

(That alone will probably ensure zero replies)...but to ensure complete silence...

Further...

In that 'comfortable' fit of X and Y - axes, does anyone notice how trends are dead easy to pot (i.e nail the end or at least the end of the real momentum phase) by using the 60 degree line connecting 'clearly visible and uninterrupted line-of-sight' lows on an up trend or highs on a down trend?

can you illustrate with a "before" and "after" chart ?
 
laptop1 said:
You been reading to many W.D.Gann books
I almost included a "No Gannites here!" warning. I actually typed it and deleted it. But yeah, I know what you mean.

Well! Who knows. I can't help this stuff. I'm channelling a 600 year-old Tibetan Monk for Chrissakes....!!!!
 
rols said:
A new Bramblometer is born...

We salute your benevolence in revealing this hitherto unknown treasure.....

PS Does it make a nice cup of tea?
You're the 3rd p!sstaker. And so it was written. "He shall encounter thricely the takers of the unbelievingness....".

Christ! Even BAT got a better reception than this....and I'm not selling....

...yet
 
trendie said:
can you illustrate with a "before" and "after" chart ?
NO!!!

That was the whole point!

Is there a combination of X-axis and Y-axis scale that gives YOU more comfort that your trendlines 'mean' something?

Try it yourself.

Do you get it?

What does it mean?
 
trendie said:
can you illustrate with a "before" and "after" chart ?
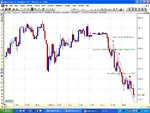
OK. This isn't a stock I trade. But it gives you a clue.

It's on a 5 min candle of GOOG.

It certainly doesn't pick ther top of the move, but it gets you out as momentum dies away.

I.E. you get to use your trading capital elsewhere on an equally HOT stock while GOOG quietens down. :LOL:
 

Attachments

  • GOOG1.jpg
    GOOG1.jpg
    452.5 KB · Views: 430
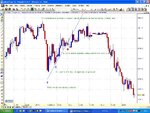
Sorry, forgot to mention. Works on down trends too (using highs).

Same chart - a little later.

Again, does't get you out at the bottom, but does get you at at the end of the prime momentum phase (i.e. most bang for your buck).

Ready to use your cash for those hot Hot HOT stocks. :LOL: :LOL: :LOL:
 

Attachments

  • GOOG2.jpg
    GOOG2.jpg
    425.5 KB · Views: 357
5 minute GOOG

a 30 period hull moving average is colored here in red and blue
i use it for trend identification

my.php
[/URL][/IMG]
 
No idea what this means:
" Does anyone else get a feel that for any given timeframe, there is a specific contraction of time along the x-axis which 'seems' more appropriate or more comfortable (sue me) for a non-logarithmic price scale on the Y-axis? "

courtesy of Advanced GET, pretend attached is a ''Trdr' Box'
 

Attachments

  • lines.png
    lines.png
    28.1 KB · Views: 368
Trdr said:
No idea what this means:
" Does anyone else get a feel that for any given timeframe, there is a specific contraction of time along the x-axis which 'seems' more appropriate or more comfortable (sue me) for a non-logarithmic price scale on the Y-axis? "
I was struggling with explaining myself clearly as you have obviously realised.

In the context of the 60 degree trendline, I was attempting to say there was a specific contraction of the X-axis (i.e. a specific number of bars per horizontal length [e.g. 10 bars/cm or whatever]) on the chart which lend themselves more easily than any other to using this construction. Not made it much clearer I suspect...

Trdr said:
courtesy of Advanced GET, pretend attached is a ''Trdr' Box'
Looks like a chart on a bad trip. :LOL:
 
Top