[Noob Post] Can we consider Dow's head and shoulder?

Hi bchung3000,
actually to be honest i am trying to roughly gauge where it is going to, not the exact point of course, to help me be biased which side i should trade with more caution and which i should trade heavier.
Fair enough. I got the (mistaken?) impression from your previous post that you relied upon rumour (i.e. other people's opinions) about market direction. If it's arrived at by your own alalysis - then that's an entirely different kettle of fish.

What is IMO by the way?
IMO = In My Opinion

Of course we would hope that pattern would complete to gain our confidence in where it is heading to, if it doesnt complete then too bad i'll not be trading it.
Anyway i am more of a day trader instead of longer term trader, therefore knowing whichever direction has higher odds gives me confidence for farther targets.

i still buy the market if my setup hits even if it's likely to fall yet i would not place heavy trades and set huge target.

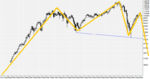
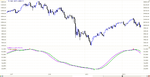
we always follow the big picture arent we? like if you are day trading you will llook at daily chart, end of day trading you will look at weekly chart and so on.
As a general rule of thumb, I think it's a good plan to gauge the general direction of the market and go with it, especially for inexperienced traders. However, it really depends on your trading style. It's entirely possible to trade predominantly to the short side in a bull market and vice versa.
Tim.
 
Well I'm like Tim really, I don't try to predict where the market is going. I don't trade the S&P, and to be honest as a day trader there isn't that much to be learnt from looking at the Head & Shoulders, thats something that would be more useful to a position trader.

For a bit of fun, imagining I was an S&P position trader, or someone looking for a good swing trade, here's my punt: No desperately bad news at the moment that is going to generate panic selling. We're in a clear downtrend, but quite overextended to the downside. Also a lot of traders will have shorted because of the break of the H&S. I think we'll see the market pushed back up towards my trendline before the next leg down, and I'd be waiting for a move in that direction with orders under the previous low once we got closer to it for a swing trade. This is a disorderly collapse at the moment, not a rout yet.

USSPX500Daily02-JUL-10.png
 
Hi timsk

Fair enough. I got the (mistaken?) impression from your previous post that you relied upon rumour (i.e. other people's opinions) about market direction. If it's arrived at by your own alalysis - then that's an entirely different kettle of fish.

As a general rule of thumb, I think it's a good plan to gauge the general direction of the market and go with it, especially for inexperienced traders. However, it really depends on your trading style. It's entirely possible to trade predominantly to the short side in a bull market and vice versa.

I do not totally rely on rumour or analysis from other people, but for reference. I am not really confident on my own analysis actually. So getting the big picture clear would aid me in judging the entry as well as the trading style.


Hi bevok

Well I'm like Tim really, I don't try to predict where the market is going. I don't trade the S&P, and to be honest as a day trader there isn't that much to be learnt from looking at the Head & Shoulders, thats something that would be more useful to a position trader.

Totally agreed with you, the pattern actually is for my position side or trading. I am also holding positions for the S&P, which also has the same H&S pattern while i am day trading the dow.

I understand chart patterns like H&S are not very relevant for day trading, but would it not affect how we place our initial target for day trading? like we always get the big picture of what we are trading, looking at daily charts when we day trade or looking at weekly chart when we trade end of day. I wonder if everyone is doing the same or no one is doing this way because it's stupid. Please enlighten me! :D

Cheers folks!:cheesy:
bchung brian
 
Bchung, dont get me wrong, no gambling on premarket, im rather gambling on a 2 to 4 rolling back over days. What i mean, is one can buy on pesimism and sell on greedy while we hopefully get a bounce going on to the declining trendline bevok mentioned. By the way, that is a great point I missed when pointing out my reasons for a bounce. I set faster time periods for stochastic 8,3,3, and it seems like is bending over even on those slower periods like 14,3,3 and 21,3,3. As for macd concern, i set 8,18,9 or 12,26,9, and also looks like it is starting to bend giving us a cue to think of an impending bounce inmo.
 
Another point, IPC mex market, is a bit up. Cant scalp, real low volume, but I can see a huge 3 week declining trendline at an hour chart frame of the stock im long, being broken at this moment for a 1% gain. I ll be watching it into the close, but this bodes well, so I guess Ill be holding it.
 
Last edited:
Bchung, dont get me wrong, no gambling on premarket, im rather gambling on a 2 to 4 rolling back over days. What i mean, is one can buy on pesimism and sell on greedy while we hopefully get a bounce going on to the declining trendline bevok mentioned. By the way, that is a great point I missed when pointing out my reasons for a bounce. I set faster time periods for stochastic 8,3,3, and it seems like is bending over even on those slower periods like 14,3,3 and 21,3,3. As for macd concern, i set 8,18,9 or 12,26,9, and also looks like it is starting to bend giving us a cue to think of an impending bounce inmo.

Hi dpinpon, Sorry about getting you wrong, I am still very new to trading:D
However I fear price will continue to drop even if the indicators are likely to bend, and that there should be no way we can predict how low the price will go before it bounces back, which means getting into a long position at the wrong timing may end up losing. I was thinking of trading the bounce too but i think it's more risky than trading along the trend.


Another point, IPC mex market, is a bit up. Cant scalp, real low volume, but I can see a huge 3 week declining trendline at an hour chart frame of the stock im long, being broken at this moment for a 1% gain. I ll be watching it into the close, but this bodes well, so I guess Ill be holding it.

May i know what the IPC mex market is?

Cheers
bchung brian
 
I would add that in my 'theorising' I was waiting for a confirmed decline after a pullback towards the trendline. Going long on this timeframe would be lunacy.
 
Bchung, happy to be full long, so far cemex is 2% up, Im not greedy, still in the need to watch. Im busy but as soon as I get a chance i ll post a link for IPC and Cemex. Good trading.
 
Sorry not very good at using my computer but could someone please put up a 30-40year chart of dow jones. Theres a head and shoulders pattern starting to form on that as well. Maybe of some interest to people.
 

Thanks dpinpon for sharing. Looks like there's a pretty strong support for CEMEX and malfunction of H&S pattern for the index, but there seem to be a resistance level @ 32000. Let's keep an eye on it :D

Sorry not very good at using my computer but could someone please put up a 30-40year chart of dow jones. Theres a head and shoulders pattern starting to form on that as well. Maybe of some interest to people.

Hi fleetwood. Could you elaborate a little like where the head and shoulders are formed? Or did you mean the right shoulder was formed in the 02 and head formed in the 08?

Cheers:cheesy:
 
Hmm Ive tried putting up a graph from advfn website that i use but Im struggling. Just look at a graph from 1990 to 2010. You have the first shoulder in 2000 the head in 2007/08 and now the last shoulder is starting to form.
My thoughts are that there will be a little play around the current levels, it may even make a push for 12,000 but fail. Then at some point will come tumbling down to make new lows, so below 7000. I just think this current bull run isnt over yet. I want to see a test of the previous highs(11,000) before I start getting really bearish.I realise the dow has fallen hard and gone below the 10,000 area which has some good support. Maybe it will take a bit more of a dive but im still bullish.
Btw probably shouldnt listen to me too much im just a noob lol. Ive made a few quid but nothing to get excited about. Just thought I'd share my thoughts.

Hi fleetwood

I am also noob that's why this post is a noob post haha.
I think you probably mean this..(see pic)
if this is true then we'll have a neckline @ 62xx. I'd rather think that this pattern is not going to complete because it took 10yrs to form the right, 4 for the head and now only 1 for the left? May be it wont be completed so soon but we shall see. Looks like 62xx to 64xx is the critical level everybody is looking at. It's not only the previous low, major supoort but also the neckline level.

Thanks for the alarm fleetwood :D:D
 

Attachments

  • DJI 95-10.png
    DJI 95-10.png
    29.7 KB · Views: 158
Last edited:
I went long with TNA yesterday with a small testing buy.

I bought more TNA near the first peak and sold it all on the first correction. TACTICAL MISTAKE. I got discouraged and went to do something else and missed the opportunity to get back in. Trading is really tough emotionally. I guess it is like trying to survive as a gladiator in the Roman Colosseum only with money and your wits. I am only picking small fights at the moment in hopes i can learn enough to survive before I give up or succeed.
I will look for a good place to go long tomorrow.
 
Last edited:
Yeah like I said I think it will bounce about for a while maybe in 2011 it will fall hard but well who knows. End of the day I trade what I see.
At the moment im long £5.00pp. Put order in to buy at 9725 this morning and so far its going quite well. I dont plan to hang around too long but hopefully it will make a push for 10200 and give me a couple of chances to add to the position. Just wait and see really. Anyway sorry im just waffling you probably couldnt give a **** what im up too.

haha congrats then. looks like you are making a good profit so far. testing 9900 resistance though. siding a little. :D

I started a long position @ 9826 just now and made a small profit :D let's do it folks! haha
 
Right bchung, Cemex went back down to restest support and bounced off. It is at same price I went long yesterday now. Im still in and expecting it to spike up into the close or tomorrow. The malfunction of H&S pattern for the index, is kind of the same for H&S pattern for Dow. Glad you re making money, which is the objective of this game.
 
I tried posting a chart of the DJIA but was unsuccessful even after uploading the image to this site. There is a divergence on the head and shoulders between DJIA and DJ utilities. Many trading books show this as a sign of lower prices ahead. This is a very classical sign which proceeded the 1974 bear market.

I was able to upload it to my blog at:
http://bj139-trading101.blogspot.com/2010/07/here-is-chart-of-djia-with-dj-utilities.html

Found it
djia_dju.png
 
Last edited:
Here is my long term Dow chart with my favorite indicators below it. You can put the same indicators on any time frame and they work very well. I have a modified stochastic with the MA's set at 34, 13 and 8, and a fractal indicator on top of that. It's not perfect but it's very good I think.

I only trade forex and the dow is the only stock index I follow.
 

Attachments

  • DJIA_07_08_2010_Week.PNG
    DJIA_07_08_2010_Week.PNG
    26.4 KB · Views: 157
Top