You are using an out of date browser. It may not display this or other websites correctly.
You should upgrade or use an alternative browser.
You should upgrade or use an alternative browser.
'No indicators' revisited
- Thread starter ford
- Start date
- Watchers 53
SOCRATES said:Because the use of time has been changed again from causative to subjective, as the bull phase takes hold. .
I find your posts about causative/subjective volume very interesting. It is actually something I have been thinking about myself along the following possibilities that can unfold:
1. Volume causing price change
2. Volume causing the lack of price change
3. Price change causing volume
4. Lack of price change causing volume
This really helps to understand what is happening and is a good example of how one must not take things "at face value" but must relate them to a broader context and to see the forest from the trees. This kind of thinking is necessary to see beyond the textbook chart patterns and to really understand what is unfolding in front of our eyes - looking INTO the chart and not AT it - as you put it.
Keep it up!
Bungle
SOCRATES
Veteren member
- Messages
- 4,966
- Likes
- 136
DrBungle said:I find your posts about causative/subjective volume very interesting. It is actually something I have been thinking about myself along the following possibilities that can unfold:
1. Volume causing price change
2. Volume causing the lack of price change
3. Price change causing volume
4. Lack of price change causing volume
This really helps to understand what is happening and is a good example of how one must not take things "at face value" but must relate them to a broader context and to see the forest from the trees. This kind of thinking is necessary to see beyond the textbook chart patterns and to really understand what is unfolding in front of our eyes - looking INTO the chart and not AT it - as you put it.
Keep it up!
Bungle
Excellent ! Now here is a gentleman capable of thinking constructively, well done !
SOCRATES
Veteren member
- Messages
- 4,966
- Likes
- 136
DrBungle said:OK here it is from 12.15 or so. Sorry about that...
Bungle
Dr Bungle this chart does not look right, please adjust your time difference to synchronise with T2W time please.
barjon
Legendary member
- Messages
- 10,752
- Likes
- 1,863
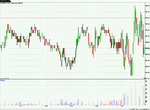
SOCRATES said:Now turn your attention to the chart. Look into it carefully. Don't look at it. Look into it.
Look at the second bar. It has a narrow spread, but the volume underneath it underpinning this result is huge. It is the greatest recorded volume in the whole chart, is it not ? Here lies the clue from which all subsequent market action develops.
Now observe that the third bar opens, lifts a little bit(which is a trap) and then collapses to close at or near the low. Why is this ?
Simple. If the previous bar (2) with all that huge volume underneath to underpin it were buying
the bar that follows it(3) would have rocketed north would it not ? .
Socrates
I come before you humble in my ignorance and virtually devoid of the intuitive skill to lift me from the herd.
You say that the high volume could not have been buying, but doesn't all selling have to be matched by buying (albeit Star Chamber selling and herd buying) and vice versa? So all I know from the first bar is that an unusually high amount of supply has arrived which has been easily soaked up by the demand? The next couple of bars show there were still buyers (presumably in the herd) willing to bid up until greater supply is fed in (presumably by Star Chamber)? Subsequently the herd is spooked and turns tail.
In earlier posts on this thread Skim has shown how price action/volume can indicate what the Big Boys (and your Star Chamber 🙂 ) are up to and I wondered if the distinction was relevant in your excellent analyses of events.
jon
Last edited:
Was reading Tao Te Ching and came across the following.
Extract is based on Yi Jing (Book of Changes).
It speaks of 3 kinds of transformation. The first 2 you have probably come across but the last was new to me. Thought it might be of interest.
1) Cyclical change - one state of thing changes into another, but in the course of such changes, the original state of things is restored.
2) Progessive development - one state of things progessively change into another, but does not revert to its original condition. Progress and development continue with time. One is not equal to another but each one contains the sum total of experiences of the preceding days plus the new day's experience.
3) The third kind is immutable law that works through all these transformations. This law causes all movements to become visible in a definite manner. If one observes the phenomena they appear overwhelming in scale and impact, and confusing in their manifoldness and multiplicity. According to this law, the principle of the creative is the active force which works through time. When this force first enters into action it does so lightly and hardly noticeable (applicable to Star Chamber buying/selling??), so that the effects can quite easily be traced. Objects of great force or destiny develop only gradually out of the light and minimal.
Also talks about Receptive principle. This is the principle of spatial mobility. When this reacts to the stimulus of the creative, all spatial change is at first quite simple and gradual, and easily recognisable without confusion. It is only in the further course of events that this simple and gradual change accelerates into a confusing multitude of impressions. And so it is important to recognise the seeds or source of growth in all things. This is the point from which one has to start if one wants to see clearly and work effectively.
F
ford
Thought I might field a question related to an analysis of my trading during the month of May.
It's kinda personal to your trading, but I'm not asking anything specific, so here goes:
What of the two makes up the bulk of your profits, frequent but small trades (1,2,3pt) or infrequent but large trades, talking 5pt's + or it's about even?
I'm just wondering if I'm trading in and out of the market too often (2pt trades) and missing the bigger moves. I feel like I am.
TheBramble
Legendary member
- Messages
- 8,394
- Likes
- 1,171
Finirama said:Also, as a suggestion, maybe better to post real time analysis (whenever this takes place) on the 5 min chart to overcome the problem of the 1 post/min constraint??
...or even use a Pal Talk or the t2w chatroom.
The boards weren't really designed for real-time stock plays.
That's not a dig at all - just a suggestion for IMHO a better alternative.
Last edited:
TheBramble
Legendary member
- Messages
- 8,394
- Likes
- 1,171
Skimbleshanks said:Tell you what, Thirteen, when I do finally make it, I'll splash out on a new $10 keyboard for you. Yours appears to have both shift keys broken. Teenagers, eh! 🙄 :cheesy:
Sorry Skim, well behind the action this week-end. I don't have anything other that US feeds either, but don't worry about 13's keyboard. Car Key Boi nicked his SHIFT-LOCK.
Ford - The only answer to that one depends on the market. You've got to adjust to what the market is doing.
I've mentioned this several times but unfortunately, most would rather turn this thread into a discussion on analysis of the PAST, NOT trading. The two are very different.
How, when and why should you reverse your position - these are the types of questions you should be asking. How does volatility affect my approach? Should I even be trading this market or that market?
All this grovelling, zero comprehension and ego that this thread has turned into is unfortunate. I'm off.
Enjoy not being worthy of your own gumption folks. Think and ye shall find!
F
ford
I fundamentally agree with this point.BBB said:Ford - The only answer to that one depends on the market. You've got to adjust to what the market is doing.
I've mentioned this several times but unfortunately, most would rather turn this thread into a discussion on analysis of the PAST, NOT trading. The two are very different.
yes you are correct, but my question does ultimately find its way to helping myself answer these questions, I know I asked a specific question without really elaborating, I probably should have been more specific.How, when and why should you reverse your position - these are the types of questions you should be asking. How does volatility affect my approach? Should I even be trading this market or that market?
What I'm trying to get at is exactly what you are saying. Are people who from what I know, trade a similar approach I do, how are they managing their positions. This is what I want to get at and answer.
For instance, reversing on a pull back and then reversing again to resume the trend, or simply holding through the pullback. It is easy to say 'adjust', but there are times when the circumstances are not clear, when pullbacks are good to reverse on and times when the counter trade will cause you to scratch for a few ticks maybe even a point. This is what I meant by I'm trading in and out of the market too often, or I feel like it anyway. I was hoping to get some sort of concensus view which would help me improve my position management style.
I'm not sure who is grovelling but I think it's worth me being polite and thankfull towards those that are interested in helping me who is in effect a complete stranger. I'm not into ego myself, I'm just a guy looking to improve his trading. I always enjoyed your posts and found them helpful when they related to trading, it will be sad to see you stop contributing.All this grovelling, zero comprehension and ego that this thread has turned into is unfortunate. I'm off.
Enjoy not being worthy of your own gumption folks. Think and ye shall find!
SOCRATES
Veteren member
- Messages
- 4,966
- Likes
- 136
ford said:My pleasure.. its the least I could do considering the massive collection of posts of yours on this forum that have helped me greatly.
Perhaps it might be best though if SOCRATES posted his own chart with annotations?
Fordy, your post ~ #738, above.
I will not post my chart because of my experience with to put it politely, the unworthy, they are
among us and we do not know who they are as they do not carry labels on their foreheads, all the time.
The reason is simple:~
There is a category of person, that no matter how much anything is explained, in what way, from what angle and how often with proofs to support the explanation,
will always find SOME WAY of CORRUPTING the explanation given or the results.
For this reason I have decided never to post my own charts.
I have been hurt in the past.
I never will allow anyone to hurt me again.
Therefore, let someone else provide a chart.
I require it done in this way so that the audit that takes place is impartial and can be proved to be impartial.
I had the experience once of tryng to help someone by allowing him to witness a live trade by voice, to try to drum in the concept of stop loss and that you must not have different positions in multiple exposures in instruments that are volatile and complex and that in addition you do not understand, without stops, and that you must not go off and mow the lawn whilst this is in progress. Yes, it is true, I kid you not.
The trade was completed successfully, and the stop removed.
He then goes to the monitor and puts his face 6 inches away from it.
What are you doing ? I asked.
To see if the feed is running.
Of course the feed is running. Check the DDE link, OK ?
I thought this was very considerate of him, and then I realised that he was seeking some way to prove that his attiude was correct, against all evidence to the contrary, and that I was trying to cheat or pretend.
He duly received his punishment.
I simply withdrew any further help.
The above was one of the lessons I was given, a very bitter one, but effective.
The lesson is learnt ~ it does not have to be repeated.
And the same goes for you finirama in your post that follows his # 739. Sorry.
That is all.
SOCRATES
Veteren member
- Messages
- 4,966
- Likes
- 136
harryp said:Socrates
Many years ago I saw a broker cross [simultaneously buy and sell ] eight thousand lots in the ftse futures pit at LIFFE. This trade accounted for more than 20% of a busy days business {I am not sure if it was 8000 but it was definitely 20% of the total }
At the end of the week I read a report from a respected analyst in which he ascribed the markets move to the significant volume that had taken place on the day I mentioned. Had he seen what I had, I doubt he would have come to the conclusion he did
Maybe something similar happened on the second day that you hilite as the key to the move ?
Perhaps what you witnessed was a put through deal, I cannot and will not comment further.
But volume is volume, which is activity, and you know if not better than most if you have been on the floor you must know what the consequences are. Please do not pretend you don't.
SOCRATES
Veteren member
- Messages
- 4,966
- Likes
- 136
5 waves irrelevant
It may mark it to you but I do not subsribe to such stuff.
But you miss the point.
The point is that all of it was stated IN ADVANCE of it developing, this includes, bottoms, turning points, etc., Look again, please.
Finirama said:Don't trade the DAX, but I'm sure you'll agree that volume would not have been necessary to spot the top. Clear 5 waves up with a key reversal bar is quite clearly marks the top and a short....does it not??
It may mark it to you but I do not subsribe to such stuff.
But you miss the point.
The point is that all of it was stated IN ADVANCE of it developing, this includes, bottoms, turning points, etc., Look again, please.
china white
Established member
- Messages
- 979
- Likes
- 12
an idea
Lads/lasses - hope u dont mind if I suggest something here 😆
We all know that QCharts is quite famous for having excellent charts but rather pitiful datafeed. Why wudnt we take advantage of what is good with QCharts?
I completely understand Soctates's unwillingness to publish charts (trust me I know the exact reason sadly) - on the other hand I find it hard scrolling thru pages on this thread trying to find the chart discussed.
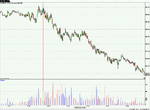
What if I publish ES charts from QCharts (price and volume) - of the sort attached to this message - and we analyse them in detail? it wud perhaps make most sense since most ppl here I belivee trade ES.
On the attached chart from Friday I have 2 min bars and 3 ma on volume (essentially normalised 6 min volume bars - blue line). I have no probs publishing 1 min or 5 min or whatever the concensus will be instead.
lemme know what u reckon
Lads/lasses - hope u dont mind if I suggest something here 😆
We all know that QCharts is quite famous for having excellent charts but rather pitiful datafeed. Why wudnt we take advantage of what is good with QCharts?
I completely understand Soctates's unwillingness to publish charts (trust me I know the exact reason sadly) - on the other hand I find it hard scrolling thru pages on this thread trying to find the chart discussed.
What if I publish ES charts from QCharts (price and volume) - of the sort attached to this message - and we analyse them in detail? it wud perhaps make most sense since most ppl here I belivee trade ES.
On the attached chart from Friday I have 2 min bars and 3 ma on volume (essentially normalised 6 min volume bars - blue line). I have no probs publishing 1 min or 5 min or whatever the concensus will be instead.
lemme know what u reckon
Attachments
SOCRATES
Veteren member
- Messages
- 4,966
- Likes
- 136
barjon said:Socrates
I come before you humble in my ignorance and virtually devoid of the intuitive skill to lift me from the herd.
You say that the high volume could not have been buying, but doesn't all selling have to be matched by buying (albeit Star Chamber selling and herd buying) and vice versa? So all I know from the first bar is that an unusually high amount of supply has arrived which has been easily soaked up by the demand? The next couple of bars show there were still buyers (presumably in the herd) willing to bid up until greater supply is fed in (presumably by Star Chamber)? Subsequently the herd is spooked and turns tail.
In earlier posts on this thread Skim has shown how price action/volume can indicate what the Big Boys (and your Star Chamber 🙂 ) are up to and I wondered if the distinction was relevant in your excellent analyses of events.
jon
You are right. But you must approach your thinking to this like Sherlock Holmes, we are looking for clues. Look for clues in an ordered fashion, not as a scattergun excercise
Sift and look apply your reason, see how it fits or does not as the case may be.
Similar threads
- Replies
- 1
- Views
- 5K
- Replies
- 0
- Views
- 2K
- Replies
- 412
- Views
- 97K