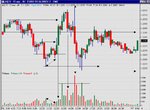
'No indicators' revisited

RE-Market Profile.

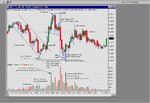
There is a good online seminar on Market profile plus others in Zapfutures . Tak a look very good.

Triplepack
 
Mr. Charts said:
It doesn't matter, imo, whether you classify any method/technique as an "indicator". The use of that word distorts the process as the common understanding is that it is a mathematical TA tool.
I think this business is about reading sentiment in one form or another.
For example, should I have gone long, short or done nothing at the moment of this screenshot?
More importantly, why?
If anyone is interested to answer, I'll post the reasoning for my decision in 24 hours.
Richard
Challenge with no upside! However:

The key features seem to be that there was very little volume when the price dropped to the low (either side of 15.50) while the last two high volume bars (at 15.57 and 16.05) were bars of very small price range and nil net movement, coming at the end of two small upward moves. This suggests supply is plentiful at this level and upside limited. So it is worth waiting for a re-test of the low, to see if that evokes more demand, and going short at about 57.80 if it does not. Stop would be just above the top of last high volume bar at 58.20.
 
My view is that one should be looking to short that stock. I would'nt be long at this pt.
 
TheBramble said:
As for Dark-Siders and Rognvald - I understand it's a bit like the Masons - they wouldn't tell you if they were.

Has he got a crumpled trouser leg ? :eek:
 
Hi all
Just hit the screen

Tony – I’m surprised at you – it was only the other day that we were helping each other to adjust our apron strings LOL.

I don’t have a US stock feed and I haven’t checked for the outcome. Mr C’s screen dump contained sufficient information for us all to have made predictions and it seems that there are 2 “stay outs”, 4 longs and 4 shorts. I was very divided as to the short bearing in mind the lack of backward information but on what there was I said what I did.

I did not use the dreaded indicators other than to note there was what seemed to be a weak cross up. It looked to me as though the last bar had closed

I will be very interested to hear what the result was and the full reasoning behind the trade Richard took.
 
Frugi
I have drawn lines which I think show my take on this one.
The long bar and large volume associated with it at 15.00 I think had the same people buying and selling within it to work the price. As Skim said- a penguin factory and they probably got it on the way up too (16.00 and 17.45). Illegitimi!
 

Attachments

  • EURO FX GLOBEX 2.JPG
    EURO FX GLOBEX 2.JPG
    116.5 KB · Views: 317
Last edited:
Gild Chart

I like this game. Only just found this thread so forgive me if I am a little late in responding.

Its clearly a short - lunchtime(ish), big volume, no movement. Gild has had a massive fall so you are going with the overall trend.
Can't work out what L2 is saying - mainly because I can't decipher the screen!! What is H Size?

The only negative is that I would not like trading at this time of day into the lunchtime chop.
I would have preferred being short on a break of about bar 18 - 20 and would now be having a glass of Chablis - mainly because I don't take new positions after lunch.

In terms of probabilities its a high reward, low risk trade.

Target 1 57.83, and then let the market tell you where to take target 2.

Russell

Mr. Charts said:
crank = shunt = fake

I'm pleased my post has brought this thread back to where it belongs ;-)

Different decisions make markets
- so all views are respected
- so expressing a view is NOT sticking your head above the parapet
- so anyone else care to give a "view"?
Richard
 
Thanks for the input folks. The penguin reference eludes me for the moment. The chart looks a bit like Pingu trying to flap his wings though. A round of this may help.

http://www.ebaumsworld.com/penguinswing.html (aww!)

Having posted that Euro chart I haven't actually much to say about it, sorry, othan that it was indeed nasty to trade! The 3.00 head fake was a news spike incidentally.

I'm also regretting my GILD long a bit now! Mind you if 8 say short and 2 say long perhaps the contrarian is ahead of the crowd, as it were :p I doubt it in my case :D
 

Attachments

  • untitled.jpg
    untitled.jpg
    127.1 KB · Views: 277
Mr. C re: GILD I write from a position of great ignorance! At first I thought this might be a Slim Jim/Henry type pattern and that you were waiting to go long. But the fact that the ask price has dropped so much and so quickly suggests GILD is due to fall further. So.... (let me just check the coin... tails it is)... short!

RobQ
 
Re: GILD again - can congnoscenti please say if price and volume correspond for one minute bars or if the volume for a given minute may not be shown until a subsequent bar. This would mean that volume, as an indicator (forgive me!), of future price might be less accurate for very short intervals.
 
He He - like the flash sequence!
Penguins live at the bottom of the world (from a UK perspective:cheesy: ) - I think thats what Skim meant

frugi said:
Thanks for the input folks. The penguin reference eludes me for the moment. The chart looks a bit like Pingu trying to flap his wings though. A round of this may help.

http://www.ebaumsworld.com/penguinswing.html (aww!)

Having posted that Euro chart I haven't actually much to say about it, sorry, othan that it was indeed nasty to trade! The 3.00 head fake was a news spike incidentally.

I'm also regretting my GILD long a bit now! Mind you if 8 say short and 2 say long perhaps the contrarian is ahead of the crowd, as it were :p I doubt it in my case :D
 
I'm going to republish this entry I saw in ET and which seems to me to be very relevant to darksiding! What do people think?


dbphoenix
Elite Member
Registered: Sep 2002
Posts: 5018

07-07-04 01:21 PM
Aoccdrnig to rscheearch at an Elingsh uinervtisy, it deosn't mttaer in waht oredr the ltteers in a wrod are, the olny iprmoetnt tihng is taht the frist and lsat ltteer are in the rghit pclae. The rset can be a toatl mses and you can sitll raed it wouthit a porbelm. Tihs is bcuseae we do not raed ervey lteter by it slef but the wrod as a wlohe and the biran fguiers it out aynawy.
 
robq said:
Re: GILD again - can congnoscenti please say if price and volume correspond for one minute bars or if the volume for a given minute may not be shown until a subsequent bar. This would mean that volume, as an indicator (forgive me!), of future price might be less accurate for very short intervals.
Actually you have got it back to front. What you have to do is to calculate inside your head according to market progression what would be the correct volume to expect for different developments. The volume then released then looks right or not. The chart does nothing because the chart is just a pictorial record of what unfolds. The problem with a one minute chart is that the volume can be carried over from one bar to the next because of the time it takes to update the bar being formed relative to the period of the bar itself being very small. The one minute bar is very useful in very fast markets to check the progression of the price ~ the homework having been done in advance of course. Different instruments have different characteristics in addition to the above, and their own "quirks" in different market conditions as well.
 
Ronvald

Is the rleeavnce to dinkdisarg get the knreel aiovd the blul siht ? Wtirnig lkie tihs is tnriig !

Regards

bracke
 
Ronald please, the cats are going to get out of the bag if you are not careful, Ronald please, Ronald.
 
Socrates thank you. Thant's what I thought might happen - that volume might be delayed for one minute bars.
 
Bracke you watch it as well because when you take away the indicators and remove the signals and obliterate the you know whats and and then what is left is what is, now they can't cope with it, and, as if that was not enough they have other problems, so please don't add to it, and be prudent.
 
Top