'No indicators' revisited

Bramble

You mention market makers.

There are many markets where market makers do'nt operate and many electronic markets that have designated mm's who's only function appears to be getting the contract going at the opening. I think all the talk of manipulation / mm's when analysing markets is useless ........................ unless one is doing what Naz does in real time
 
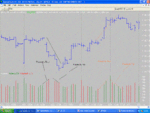
Graphic representation to elaborate on Brambles post.

First one is the parabolic rise/fall.
 

Attachments

  • Parabolic Rise_Fall.GIF
    Parabolic Rise_Fall.GIF
    232 KB · Views: 369
I think indicators are actually the exact opposite of information overload. They actually highlight the most important bits of information. The human brain needs to have things pointed out, highlighted categorised. Its how it works.. you just give it a helping hand.

Where is the price in relation to its average? Has the change per day dropped or increased? Does the volume tend to go in the movement of the trend or opposite? Indicators are vital... and I feel if you try and trade without them. You are just going to make things difficult for yourself.

But if that is the way you want it. I just dont see the point of delibrately denying yourself aids that have been proven to be a big benefit in chart analysis.

I get a feeling this isn't a thread for debate or giving opinions that dont agree with having 'no indicators'... so I'll leave you to it and start my own.

And by the way... yes I did have to state what I stated in my last post! Im unclear of the rules of some threads and didn't want to get banned. This thread has been mentioned in the sacrosanct 'basement' thread... that people who want to debate and have opinions should leave this thread alone. But I wasn't too sure if this still held... so I asked to make sure?
 
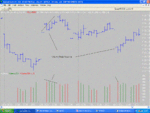
Volume Fade reversal. I look out for these after gaps or very quick moves. Also important to watch volume after the fade.

Wrt to indicators, if you find them of use then great. If not, don't use them....its as simple as that.
 

Attachments

  • Volume Fade Reversal.GIF
    Volume Fade Reversal.GIF
    230 KB · Views: 299
Finirama said:
Graphic representation to elaborate on Brambles post.

First one is the parabolic rise/fall.

Which kind of kills one of my hypotheses - "The descending parabolic volume indicates lack of support for current trend".

In this chart, the Ascending parabolic volume ushers in the fall in price and continues to fall in price in the parabolic volume descent as well. Back to the drawing board!
 
qaza said:
There are many markets where market makers do'nt operate and many electronic markets that have designated mm's who's only function appears to be getting the contract going at the opening. I think all the talk of manipulation / mm's when analysing markets is useless ........................ unless one is doing what Naz does in real time
I guess my use of the term was a little 'narrow'.

My meaning was for any BIG market player that had the muscle to move the market and/or the mechanics and wherewithal to do so. As opposed to little retailers.
 
Bramble,

Look at the chart again and then re-read your last post!!

Then look at what happen after the parabolic volume descent.........you may find that have got it right!!!
 
pkfryer.
I would tend to agree with you regarding indicators to some extent.
I now concentrate mainly on the analysis of price and volume but when it comes to entering a trade I do make limited use of just one indicator which does help me to decide whether my analysis of price and volume is sound.
 
You also need to consider that on Finirama's first chart, those parabolic rise/falls, as you call them, happen over the close of one day and the open of the next.
 
Finirama said:
Bramble,

Look at the chart again and then re-read your last post!!

Then look at what happen after the parabolic volume descent.........you may find that have got it right!!!
Fin, take your point. :eek:
 
Skimbleshanks said:
You also need to consider that on Finirama's first chart, those parabolic rise/falls, as you call them, happen over the close of one day and the open of the next.
Skim, I can't make out the white on grey timescale. How can you see it so clearly. And please, no carrot jokes!

Edit:- with the timescale now clear (thanks Fin) what is it that I need to be considering about the parabolic volume rise/fall occurring over end/start of 2 market sessions?
 
Last edited:
Bramble,

There should be a little box on the bottom right hand of the chart pop-out which expands the chart to full size.
 
Here's one that worked well amongst the many that don't.
EDIT: GOT CHARTS IN WRONG ORDER OPEN 3,1,2
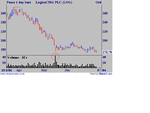
Chart 1

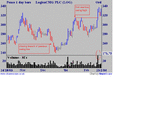
If you'd been swing trading Logica you might have been closed out of your long when the price breached the swing low, then gone short on the first reaction swing high only to have been stopped out when the price rose above it.

Volume was extremely high on stopout day and could be viewed as a buying climax with with a lot of supply coming in. The next day price edged higher but fell back to form a doji although on lower volume. All this was occuring only just above the Nov highs so it might have tempted you to re-instate your short with a stop just above the doji high.

Chart 2

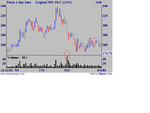
If you had been tempted you'd have been right but after a few days there was even higher volume and maybe a selling climax already. It didn't seem to follow through, but probably wise to move stop down in case. Then another swing high (red line) and a repeat sell signal.

Chart 3

All goes well then very high volume again and a selling climax? No follow through though and although supply seemed to have shrunk no strong demand apparent. Cover and run!!

In accumulation phase since then?

Pretty rudimentary use of volume - any analysis from the experts?
 

Attachments

  • log1.gif
    log1.gif
    12.8 KB · Views: 294
  • log2.gif
    log2.gif
    11.3 KB · Views: 300
  • log3.gif
    log3.gif
    9.7 KB · Views: 259
Last edited:
pkfryer said:
I was thinking about no indicators... and want to throw something into the wash!

An indicator is often or not created from the open,high,low,close and/or volume. Nothing in an indicator can't be seen by looking at a plane chart anyway. But they underline and highlight specific aspects.

Like OBV... underlines where volume is in relation to price movement and actually shows you something you would never see by just the raw data alone. Various other indicators just highlight rate of price change, change in relation to recent high and lows... highlight trends that can be muddied with the random noise.

Surely by cutting out indicators you are actually just making it harder on yourself to interpret a chart? Indicators are directly derived from that data anyway! Any differences between just using price/volume and using indicators as well... is actually an artificial one. You make life harder on yourself.

Heard of information overload? So much information that you can't interpret it... but when it is clarified, filtered, categorised, and highlighted... you actually aid the brain in interpreting that data. Filtering, pre-processing of information doesn't actually lose anything, it merely helps us from miss something important!

I apologise if this has been brought up and discussed before... Im new to the thread but have been meaning to post my view for a while. I presume this is no longer holy ground now the threads are split and anyone can come in and discuss things related to the subject. Is this a freedom of speech and thought zone now?


Ignoring the last paragraph....yes this has been discussed before. Indicators are said to be akin to using stabilisors on a bicycle until you become skilled and practiced enough to ride without them.Indicators are always living in the past.
 
Barjon

No expert but I see the three charts in terms of channels and breakouts
See red lines on your charts in attached .doc

Red line in last chart should be on 173.75 level with the high vol spike last bears covering (or attempted breakout or both) & beginning of accumulation (consolidation) (20/20 hindsight:cheesy: ) but I did cover up the RH side of the charts as I went along:idea:
 

Attachments

  • barjon .doc
    514 KB · Views: 335
Last edited:
Barjon,

As you know i'm cerainly no expert but i'll have a go, hopefully to get some futher comments on how other people might perceive or traded otherwise.

Wrt to chart 1....the rise upto 320 take place on increasing volume with bars 14/15 taking showing highest upto that point. Bar 16, the last blue bar upto 320, to me at least, is where the action starts. Notice how this bar gaps up at the open, moves higher, probably in the morning, BUT closes lower and at the mid of bar 15. Now this happens on lower (stil relatively high) volume. This shows that demand has dried up with nobody left to buy. This is confirmed by the next two down bars17/18, which move down on even lower volume and bar 19, which confirms as a failed retest of the high on lowest volumes yet. You could have shorted here, with a stop at 320, or played it safer by placing a sell order at the low of bar 19 and stop at top of bar 19.

Volume starts to pick up on the move down and starts to dry up towards the end of the move. Its the last three bars (27,28,29) of this swing down to 270 which give the hints to the reversal.

Bar 27, opening lower than previous bar, BUT closes higher on higher volume, showing support is starting kick in.
Bar 28, the grey bar, is a wide range bar, showing a real tug of war. The bears midly win with a close lower, but still well above the low of bar 27. A turn is imminent and is confirmed by bar 29.
Bar 29, creates a tweezer bottom with bar 28 and closes above the close of bar 28. The important thing to notice that it is on low volume.

So wot to do here? Close the trade? Close half, and leave open? I personally would have closed half and the let the other run...as is the next bars which will confirm whether this is a true reversal or not.

Bar 30 closes high on lower volume, but bars 31 and 31 cloe near low on higher volume, showing that resistance is still in play and a that this is just a swing. I would now move my stop to the high of bar 31.

To be continued later.

Fin
 
would have closed the rest of the short on down bar 34, seeing this as a failure swing.
 
Rog - I get what you mean even if the picture is of my earlier stab at ftse :)

Fin - all hangs together for me, and you haven't even got to the point when I even noticed the volume yet :)
 
OOPS
Not my day is it!:LOL: :eek:
Me and my channels
B file's too big as well - won't upload - I'm going to sulk in front of the TV:rolleyes:

barjon said:
Rog - I get what you mean even if the picture is of my earlier stab at ftse :)

Fin - all hangs together for me, and you haven't even got to the point when I even noticed the volume yet :)
 
Last edited:
Top