Mystical Ju-Ju

trendie

Legendary member
Messages
6,875
Likes
1,433
I have, probably against my better judgement, re-ignited my interest in Delta, and all things mystical and nebulous.

How do you "prove" something?
I suppose its by stating a proposition, and then proving it as being true, according to some pre-determined parameters.
for example, that patterns repeat themselves after every 4 lunar months.
but what if the patterns dont arrive on time?
how much wiggle room do you allow?

if a pattern is supposed to arrive every 10 days, for example, the more days you give it for wiggle, the more likely you are allowing for noise.

eg;
10 day pattern start: 0 days.
next pattern: 10 days.
next pattern: 20 days.

if you allow 1 day grace either side, thats 3 days variability for a pattern that supposedly repeats every 10 days.

you could make excuses such as: oh, its trading days, not calendar days (this time), or holidays. (actually, for FX, what if the US has a holiday, eg July 4th, but we in the UK dont have a holiday, then is this a holiday, or not a holiday?)

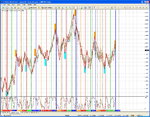
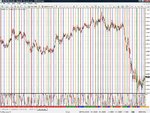
One alternative method is to start with no preconceptions, and see if swings happen with any regularity. here, to avoid too many close calls, ie, every 2 or 3 days, you can use an objective method of determining swings. And then count the days that elapse between them, and determine some pattern. If some pattern appears, but not always, you can explore further.
this prevents self-delusion, ie, a commitment to an unproven concept and massaging of figures to re-interpret the data to a pre-determined conclusion.

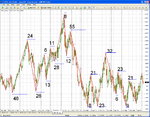
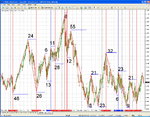
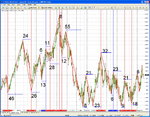
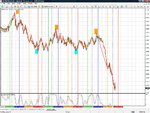
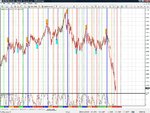
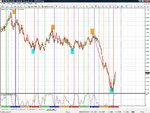
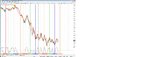
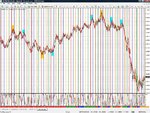
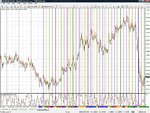
I have posted a swing map of GBPUSD using zig-zag set to "8,5,3".
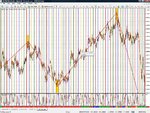
rather than say "I believe that patterns repeat every 4 lunar months", it makes more sense to say "I see swings being 21 days more often than chance would allow".
there again, how would be determine what chance would allow?

when using Fib-counts, for MarketMatrix, for example, what if days 8,13,21 and 34 dont "hit", why would you therefore expect day 55 to hit? wouldnt you abandon it as being not valid?
 

Attachments

  • swings_01.jpg
    swings_01.jpg
    382.4 KB · Views: 314
now for trading days/calendar days malarkey:

if you are going to use external influences to determine market behaviour, it is important to realise that the sun and moon continue to do their orbity stuff even when we are not trading.

so, what that means is that swings may occur over the weekend. this isnt so difficult to understand. this would be like not recognising a full-moon occured on a weekend, because you only looked up at the sky on weekdays.

What this means, is that swings that occur on Fridays or Mondays have the potential of being out by upto 2 days.

If a swing appears on the chart on a Friday, the real swing may have occurred on Saturday or Sunday, but is not obvious as there are no price bars for those days.
Equally, a swing occurring on a Monday could have occurred on Sat or Sun for same reasons.

Therefore, swings can have a legitimate variances.
What I have done is take the chart on first post and added lines where the swings occurred on Mondays (blue line) and Fridays (red line).

this allows us to ponder what patterns might give us if we shifted values around, but by no more than 2 days.

of the 18 or swings I have marked, no less than 8 are swings occuring on a Friday; 2 are swings occurring on a Monday, the rest mid-week ones.

something more down to earth appears, as there are considerable swing highs/lows on Fridays.
This need not be a mystical phenomena, but still gives us some insights to utilising this for trading purposes.

what does this mean? well nothing specific. except, if you start looking for magical fib-counts, and seek them to the exclusion of anything else, even force-fitting things, you run the risk of missing something more humdrum and mundane like Fridays are swing hotspots.
 

Attachments

  • swings_02.jpg
    swings_02.jpg
    406 KB · Views: 257
I’m delighted the mystical ju-ju has been given CPR.

A far more useful technique in the proving of anything is to set about proving it wrong. You only need to do that once whereas the proving right route requires infinity.

Cycles do exist. Everywhere. Even in the financial markets. Sometimes.

Do they exist as a function of astrological or geophysical forces? I personally doubt it.

Do they occur on a regular enough basis for anyone to recognise them and utilise them for profit. Not that easily otherwise everyone would, and therefore, wouldn’t.

I may have forgotten the detail, but from when I looked (and used) Delta, WW used the lunar cycle as a usefully regularly reoccurring marker rather than as a cause. And his manual method (for you cheapskates who didn’t buy the software) was to do exactly what cycle chartists do and that is to look for the major low points (high points also work, but lets stay with the traditionalists for a while) and mark their occurrence to determine what the cycle length (if any) is. I say if any, as lows don’t always occur at regular intervals – obviously. Delta/MM make up for this by suggesting, depending on the TF being traded, a degree of leeway +/- mins, hours, day, months. At first sight, this is better then nothing. On closer inspection, it’s worse than nothing as it leads you to start expecting and anticipating that which is not necessarily there. The degree to which your trading finger muscles twitch is a function of the expectation your trading mind has of the imminence of a trading event. One way round this is to assume there will never be another trading opportunity, but some folk are hyper-suggestible and this leads to a different kind of trading death.

If cycles operated at all times in all things in the same way, even if they were complex multi-sinusoidal superimpositions over each other, you’d find them. (To save some a false start, Fourier Transform will not sort it out – wrong sort of data. Sorry.)

The thing is, cycles exist when they exist and don’t when they don’t. They do often enough. I don’t know why and it doesn’t matter. To do a cycle analysis on any instrument you have to make an assumption some form of complex cycle waveform exists and then prove that it doesn’t. If one existed for this specific instrument before, you also need to assume the waveform is completely different this time and then attempt to prove that wrong. I’ve found that going to any more than 4 levels of superimposition makes the enterprise unwieldy and more prone to error than a coin toss. It also begs the question whether you’re a trader or an analyst – first and foremost. A trader will cut his or her losses on time spent as well as money in what is worth pursuing. An analyst will put in countless hours (for the love of it) on something that will not necessarily payback in anything other than intellectual satisfaction. There’s no right or wrong in either of these, but it’s important to be clear on what it is you’re really doing at any given moment in time. A trader will be looking to make money with his or her knowledge on a pretty much immediate basis with a large dose of experientially fuelled knowledge normally referred to as intuition. An analyst will be playing with charts, compasses, pointy purple hats and dusty, ancient Egyptian and Aramaic texts in order to conjure up the ju-ju.

Both are endeavours of inestimable value and worth and I regularly indulge in both. But it’s important to be aware of which is which and why you are doing it.

Trendie, good luck with this one. I genuinely look forward to reading the responses from others who have gone down this track.
 
I’m delighted the mystical ju-ju has been given CPR.
........

Do they occur on a regular enough basis for anyone to recognise them and utilise them for profit. Not that easily otherwise everyone would, and therefore, wouldn’t.
.........

Trendie, good luck with this one. I genuinely look forward to reading the responses from others who have gone down this track.

not so fast.
you may have got it with regards to the utility of it all. cycles may look pretty, but ultimately its about the money.

much as I enjoy Delta, its MAs and Stochastics that pay my bills. (and maybe CCIs as well)

if these cycles dont hit everytime, we then rely on money management, and statistics.
thats no different to using "special" settings on indicators to trade.

maybe the search for some mystical nature is a reflection
of our inner spiritual nature, where we seek meaning when perhaps none exists.

I am more and more inclined to believe we see ourselves in the markets.

(thankfully, GBPUSD behaved itself, as did EURJPY for a nice start to the week. except I bailed out at round number on GBPUSD because of the sharp reaction, even though it eventually blew through on second attempt.)
hope you had a good morning, and getting ready for the US-session.

unless someone else writes something of usefulness, I may dump this thread.
 
an update on the ju-ju.

the two screen-shots show:
1: there are two more swings added since last screen-shot, one of 18 days, and another of 6.
neither appear to me to be a Fib number.
2: the Delta lunar-thing. The orange block shows where, in the past, there appeared to be a swing-point a few days before the "blue" line. (and due right now for next one. will it highlight a swing-high and GBPUSD drop from here?)
 

Attachments

  • juju_001.jpg
    juju_001.jpg
    408.3 KB · Views: 302
  • juju-delta_001.jpg
    juju-delta_001.jpg
    456.7 KB · Views: 527
Last edited:
using the clear swing high on GBPUSD 09-Nov-07 as a starting point
(clear in that the swing point is pretty much unambiguous), I am counting potential fib-counts from thereon.
NB: not counting anything less than 8. reason for this is a day variance means thats a 2 day (ie, 25%) difference, and you can prove just about anything if allowed a 25% variance.
NB2: since the swing-high occurred on a Friday, and you could argue the "true" swing happened on Sat or Sun, but the market was closed, I will accept a 2 day variance.

so;
0 days: 09-Nov-07
8 days: 17-Nov-07
13 days: 22-Nov-07
21 days: 30-Nov-07
34 ays: 13-Dec-07
55 days: 03-Jan-08
89 days: 06-Feb-08
144 days: 01-Apr-08
233 days: 29-Jun-08.

looking at the chart, I can see no swing-highs or swing-lows that fall within those days.
even if you could, for example, find a "hit" on day-89, why would you expect a hit on day-89 if it has generated a miss on day-21, day-34 and day-55?

if you argue that you cant know in advance, and its just a guide-line, then how is that different from taking a CCI-50 cross-over, and using it as a guide-line?

still in search of the elusive ju-ju.
 
yeah, but that 1.618 fib extension to the "blue line" reversal is just coincidence, aint it?
 

Attachments

  • delta-jul-22.jpg
    delta-jul-22.jpg
    345.3 KB · Views: 217
coming back to the notion that all points (whether they are elliott, delta, supres) are still not guaranteed until after the event, and thus, as good/bad as indicators, how could anyone have known, in advance, that the supres at the "orange boxes" was going to hold, when previously the supres at the "aqua boxes" had held more often?
its still a risk with uncertain outcome?
 

Attachments

  • supres-jul22.jpg
    supres-jul22.jpg
    419.1 KB · Views: 212
the next full-moon is Sep-15th. this will be the "Red" line, which from previous history has indicated a reversal about a week before the full-moon.

2 pictures: one is a scrunched up review, to highlight the 2-monthly swings, as marked by the blue and orange rectangles.
the second one is a clearer picture of recent swings.
 

Attachments

  • delta-update.jpg
    delta-update.jpg
    257.8 KB · Views: 367
  • scrunched.jpg
    scrunched.jpg
    302.9 KB · Views: 224
the next full-moon is Sep-15th. this will be the "Red" line, which from previous history has indicated a reversal about a week before the full-moon.

2 pictures: one is a scrunched up review, to highlight the 2-monthly swings, as marked by the blue and orange rectangles.
the second one is a clearer picture of recent swings.

How about this phenomenon?

FIREBALL OUTBURST: This morning, Sept. 9th, a surprising flurry of fireballs lit up the sky over eastern parts of the United States. All-sky cameras at the Marshall Space Flight Center in Huntsville, Alabama, recorded 25+ meteors, most as bright as Jupiter or Venus. A preliminary analysis by NASA astronomers suggests this is an outburst of "September Perseids," a little-known shower that has erupted this way three times in the past century. Although the show is almost certainly over, sky watchers are advised to be on the lookout for more fireballs tonight and in the nights ahead; the September Perseids are not well understood and they could surprise us again.

Visit SpaceWeather.com -- News and information about meteor showers, solar flares, auroras, and near-Earth asteroids for more information and updates to this developing story.
 
I couldn't help but notice you are looking for the "Mystical Ju-Ju". I just happen to have it right here on my desk with me right now. Now normally I wouldn't do this, but you sound like someone I can trust it with, so I would be more than willing to sell it to you for the low low price of only $25,000.00.
No refunds!

Sorry did I say $25,000.00 I meant to say $50,000.00. I forgot about the note on my boat.:cheesy:


All kidding aside have you used any of this kind of information in your trading?
Did it help or hurt?

when I first started, I was enamoured with "predictive" systems, such as Fibs, Gann, Elliott, etc, which purported to predict times and prices. then came Delta.
I have weaned myself off these, but am still fascinated by them.
some wold argue that the real "predictiveness" comes from HigherHighs, HigherLows, pin-bars, Support/Resistance, etc.

I am just interested in them academically. thought it would be fun to keep the charts updated.
should do one for Elliott as well, really.
 
Sorry to sound like I was making fun of you, I wasn't. I was poking fun but that's just not the same.
I never liked Elliott myself, but seem to be attracted to Gann stuff. Funny thing is I was just as good with the elliott stuff as with most of the Gann stuff just liked Gann better.
Happy trading to you and if you do find the "Holly Grail" don't tell anyone. Well you can tell me if you want and I'll knock an easy grand off that $50,000.00! That's just the kind of guy I am:innocent:
 
Just fancied updating my Delta counts.
I use USNO for full-moon dates.
 

Attachments

  • delta-apr09.jpg
    delta-apr09.jpg
    284.3 KB · Views: 156
  • Like
Reactions: 2be
As an exercise in re-investigating Delta, I have:
swapped over the Red lines to Green, and Green to Red, to follow Delta colours.
(this is purely cosmetic, and to ensure future consistency with other peoples readings)
These colours taken from "The Delta Phenomenon Study Guide". (Green, Red, Blue, Orange)
 

Attachments

  • delta-new-001.jpg
    delta-new-001.jpg
    430.9 KB · Views: 195
Last edited:
Now, solving the Intermediate Term Delta, ITD, a cycle of every 4 lunar months.
(the cycles are NOT related to the moon. The lunar cycles are merely a useful framework to work with.)

One of the principles of Delta, is that key reversals, or Inversions happen at the same point on the cycle. ie, every 4 lunar months.
I will now attempt to identify these Inversion points (Point 1) as a starting point.

To avoid introducing personal biases, I will use the Zig-Zag function to lead me to some objective conclusion.

I started with Zig-Zag of 200, (ExtDepth).
(the other numbers kept as they are, (ExtDeviation, left to default 5, and ExtBackstep left to default 3. changing these resutls in no meaningful changes.)

I kept changing the ExtDepth value, and the zig-zag remains the same for an appreciable time.
The chart shows zig-zag set to 120. (I started from 200, and then reduced the values to 180, 160, 140, etc, with no difference)

The picture shows a possible Inversion points between the Red/Blue section.
(I will start off looking for a generalised area, and will then focus into for more detail and accuracy.)
 

Attachments

  • delta-new-002.jpg
    delta-new-002.jpg
    433.1 KB · Views: 164
Here we go....

I have reduced the Zigzag to 40. More hits.
The light-blue squares are the additional hits.
The first two light blues are "force-fitted", as the zig-zag is over-ruled.
But the highs/lows are "obvious"??

The other zig-zags appear, on the face of it, not to be as pronounced as the Red/Blue hits.

I am going to pursue the Red/Blue as potential Inversion Points.
 

Attachments

  • delta-new-003.jpg
    delta-new-003.jpg
    434.3 KB · Views: 167
This is where it might get interesting.
The reason why the points arent always "on time", is due to the higher Deltas, the Long-Term Delta (4-year cycle LTD) and Medium-Term Delta ( 1 lunar year cycle, MTD) also have their impact on the lower Deltas.

For example, although the ITD may be in an upswing, the Higher Delta may also be in an upswing, and make the points come early/later, or the Higher Delta may be in a downswing, consequently, this may move the ITD points out.

The MTD chart here is to see if there is validity in this. ie, see if an MTD upswing/downswing makes the turning points come earlier/later sufficiently often for it to be significant.
 

Attachments

  • delta-mtd001.jpg
    delta-mtd001.jpg
    309.4 KB · Views: 187
Top