Dentalfloss
Legendary member
- Messages
- 63,404
- Likes
- 3,726
a lot of earnings reports next week.which are the important ones.?
Anyone out there?
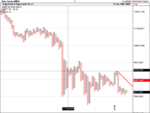
Just took this short for 21 points. Going out for the rest of the day so nice when it happens! Good luck everyone for the rest of the day.
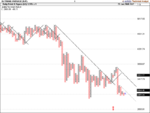
narrow range so far.anybody done anyfink.?