Message For Ftse Traders......

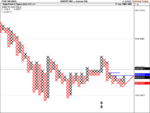
4184 enry and 4165 exit.these might ot be apparent on a candlestick chart.my setp is 4points by 3 reversal on a tick chart for the trend.3 points by 3 for signals and 2 by 3 for entries and exits
all i am doing is taking the trade when all 3 show the same signal

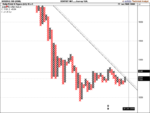
Funny how we get there for different reasons, for me a clear line of support 4185, so a break and 4165 is the intraday low so i ould expect resistance.
 
Trading the FTSE

I would like to join in if I may?

Currently short on the FTSE entered at 4165 looking for a break down to 4120.
 
Dentist,

Loads of Divergence today on 5 min chart. I took trade 2 but got stoped out at B/Even when i had 9 points in the bag and also trade 4 and did the same thing and missed 12 points so a flat day for me but it's all part of the process!
For the record the no1 is not a trade would look at but there is a small scalp.
 

Attachments

  • snapshot-75.png
    snapshot-75.png
    178.2 KB · Views: 97
here is my trend chart for today.
basically rangebound and very choppy.in my opinion ,oscillators dont work well in these conditions.can u prove me wrong.?
 

Attachments

  • ftse.nodirection.png
    ftse.nodirection.png
    13.2 KB · Views: 122
here is my trend chart for today.
basically rangebound and very choppy.in my opinion ,oscillators dont work well in these conditions.can u prove me wrong.?

I think my chart picks out some good winning trades today, if you factor in your comment about rangebound and choppy then it comes down to what profit to take.
I stopped out on 2 trades for Break Even, if i had perhaps thought about it today was more a scaplping day to take 5+ points per move. I missed 22 points on those trades chasing the move that never came but was in profit!
If we can learn a bit more every day from our experiences it can only serve us well.

agreed with you chelski.
some decent ones there,but lack of follow thru on some.how do the setups work on the 1 min chart.?probably,the only thing that you can do is to go down a t/f
what exits are you using.?
 
chelski:my thoughts on oscillators
that when you use them to show divergence,the timeframe must have as many waves of up/down movement as possible ,to be able compare their movement to the price movement.therefore on ranging days with chop the trends are very short lived
let me know youre thoughts
 
To be honest i don't get that deep, i like to trade what i see. If the trend is down but divergence gives me a long signal it may well be i only take a small move, if it steams on i kick the dog and move on (try too!) i like to have more than one factor going for a trade, divergence + candle pattern + D/Top/Bottom etc. I often compare 10 min to see if it is giving the same signal.
If i get a trend reversal and we have moved 60-or so points i use fib lines for my exit, i also look at the candle, a powerful 10+ candle will keep me in a trade longer.
 
agreed with you chelski.
some decent ones there,but lack of follow thru on some.how do the setups work on the 1 min chart.?probably,the only thing that you can do is to go down a t/f
what exits are you using.?

I only work on 5 and 10 min. i find 1 min to fast. If you look at my chart, trade 3 and 4 are formed over an hour or so, the give good entries as we are near the 0. I will have been stalking these trades as you often get false breakouts before the move. You could trade them for 4 or so points but i believe that the best trades are the obvious ones as everone else will see them and therefore add to them.
 
an area of strong resistance now looming on the horizon at 4240.the trend is upwards on this chart.4240 could be a tough nut to crack.also some res at 4300
eod.1.5% log box size.1 box reversal.hilo data
 

Attachments

  • ftse100.eodhilo.1.5%by1.png
    ftse100.eodhilo.1.5%by1.png
    35.8 KB · Views: 127
an interesting chart.the nas 100 has staged a minor breakout and is testing a long term downtrend line
data is eod.15 point box size by 1 box reversal.hilo data
lets see if this breakout survives
 

Attachments

  • nas100.15 by 1 hilo.eod.png
    nas100.15 by 1 hilo.eod.png
    33.6 KB · Views: 124
now ,the nas 100 is starting to outprform the dow on a relative basis.breakout column/upwards.risk apettite seems to be returning
box size is 0.5% by 1 reversal.ie the nas is outperforming on a relative basis.%
 

Attachments

  • nas100rel to dow.png
    nas100rel to dow.png
    32 KB · Views: 141
Short 4264 out for 13 points. Seems to be held up on .382 fib level. will cut and run after yesterday. Nice divergence and shooting star for entry.
 

Attachments

  • snapshot-76.png
    snapshot-76.png
    185.3 KB · Views: 139
chopy trading today, although slow.

sold @ 4299 looking for a break down to yesterdays close, wrong! bought back @ 4206 then went long @ 4206 looking for a break higher and sold out @ 4216..nice 10 ticks in the bin.

then sold after the peak @ 4223 looking for break to 4200 bought back @ 4206...nice another 17 ticks in the bin.

Nice work, i assume by your numbers you are on futures.
 
Top