Martin Kay
Well-known member
- Messages
- 429
- Likes
- 0
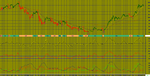
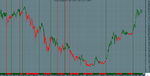
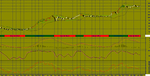
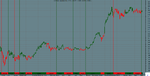
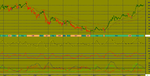
USD/JPY WEEKLY as of Monday, 30 March, 2015
A black body has formed as prices closed lower than open.
The previous 10 candlestick bars, there are 2 white candles versus 8 black candles with a net of 6 black candles.
The previous 50 candlestick bars, there are 25 white candles versus 25 black candles.
Three black candles has formed during the last three bars. Although these candles were not big enough to create three black crows, the steady downward pattern is bearish.MACD is BEARISH as the MACD is below the signal line.
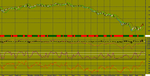
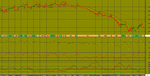
The MACD crossed below the signal line 7 period(s) ago. Since the MACD crossed the MACD moving average, US Dollar / Japanese Yen's price has decreased 0.77%, and has been fluctuating from a high of 121.404 to a low of 118.327.
The MACD is currently not in an Overbought/Oversold range.
There have been no divergence signals during the last 5 periods.
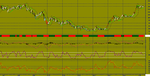
The Stochastic Oscillator is currently below 20. This is an indication of the security being in an "oversold" condition. No Stochastic Buy or Sell signals generated today. The last signal was a Buy 50 Period(s) Ago.
The RSI is not currently in a topping (above 70) or bottoming (below 30) range. A buy or sell signal generated when the RSI moves out of an overbought/oversold area. The last signal was a Sell 78 period(s) ago.
The RSI has just reached its lowest value in the last 14 period(s). This is BEARISH signal.
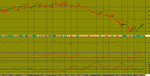
Currently, the Momentum Oscillator does not show an overbought or oversold condition.
The last Directional Movement Indicators (DMI) signal was a SELL 7 period(s) ago.
There were no SAR signals generated today. The last SAR signal was a Sell 7 period(s) ago.
The close is currently
ABOVE its 200 daily moving average
BELOW its 50 daily moving average
BELOW its 20 daily moving average
The current market condition for US Dollar / Japanese Yen is Mildly Bullish
US Dollar / Japanese Yen closed above the lower Bollinger Band by 10.0%. Bollinger Bands are 25.47% narrower than normal. The current width of the Bollinger Bands (alone) does not suggest anything conclusive about the future volatility or movement of prices.
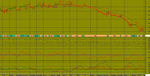
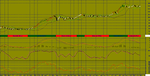
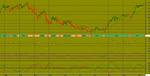
A black body has formed as prices closed lower than open.
The previous 10 candlestick bars, there are 2 white candles versus 8 black candles with a net of 6 black candles.
The previous 50 candlestick bars, there are 25 white candles versus 25 black candles.
Three black candles has formed during the last three bars. Although these candles were not big enough to create three black crows, the steady downward pattern is bearish.MACD is BEARISH as the MACD is below the signal line.
The MACD crossed below the signal line 7 period(s) ago. Since the MACD crossed the MACD moving average, US Dollar / Japanese Yen's price has decreased 0.77%, and has been fluctuating from a high of 121.404 to a low of 118.327.
The MACD is currently not in an Overbought/Oversold range.
There have been no divergence signals during the last 5 periods.
The Stochastic Oscillator is currently below 20. This is an indication of the security being in an "oversold" condition. No Stochastic Buy or Sell signals generated today. The last signal was a Buy 50 Period(s) Ago.
The RSI is not currently in a topping (above 70) or bottoming (below 30) range. A buy or sell signal generated when the RSI moves out of an overbought/oversold area. The last signal was a Sell 78 period(s) ago.
The RSI has just reached its lowest value in the last 14 period(s). This is BEARISH signal.
Currently, the Momentum Oscillator does not show an overbought or oversold condition.
The last Directional Movement Indicators (DMI) signal was a SELL 7 period(s) ago.
There were no SAR signals generated today. The last SAR signal was a Sell 7 period(s) ago.
The close is currently
ABOVE its 200 daily moving average
BELOW its 50 daily moving average
BELOW its 20 daily moving average
The current market condition for US Dollar / Japanese Yen is Mildly Bullish
US Dollar / Japanese Yen closed above the lower Bollinger Band by 10.0%. Bollinger Bands are 25.47% narrower than normal. The current width of the Bollinger Bands (alone) does not suggest anything conclusive about the future volatility or movement of prices.