Martin Kay
Well-known member
- Messages
- 429
- Likes
- 0
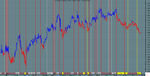
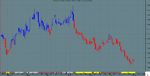
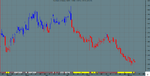
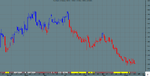
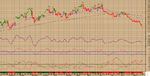
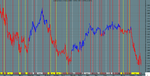
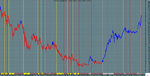
EUR/USD DAILY as of Tuesday, 29 July, 2014
VIT Daily Analysis
Review of Euro Dollar / US Dollar (EURUSD)
as of 29/07/14
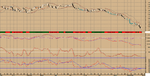
Volatility Analysis
On 29/07/14, Euro Dollar / US Dollar last price up 0.0001 at 1.3438
Period Statistical Change
10-period 3.0348 -0.27
21-period 3.3426 -0.38
39-period 4.0561 -0.01
90-period 4.2463 -0.01
Bollinger Bands are 35.97% wider than normal.
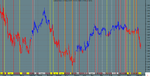
Momentum Indicators
Stochastic Oscillator
The Stochastic Oscillator is 12.9053. This is an oversold reading. Monitor for reversal signal when the Oscillator crosses above 20. The last signal was a buy 15 period(s) ago.
Relative Strength Index (RSI)
The current value of the RSI is 30.35.This is not a topping or bottoming area. The last signal was a buy 1 period(s) ago.
Commodity Channel Index (CCI)
The current value of the CCI is -97. This is not a topping or bottoming area.The last signal was a buy 0 period(s) ago.
MACD Momentum Indicator
The Moving Average Convergence/Divergence INDICATOR (MACD) crosses its 9 period signal line which triggers a sell 13 period(s) ago.
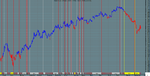
Trend Analysis
Aroon
There were no Aroon signals generated today. The last signal was a Buy 60 period(s) ago.
Directional Indicator
There were no Directional Indicator signals generated today. The last signal was a Buy 229 period(s) ago.
MACD Trend Signal
There were no MACD Trend signals generated today. The last MACD Trend signal was a Sell 10 period(s) Ago.
Stop and Reverse (SAR)
There were no SAR signals generated today. The last signal was a Sell 10 period(s) ago.
Summary
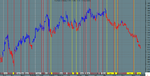
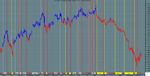
The current market condition for Euro Dollar / US Dollar is: Very Bearish
The close is currently below its 200 period moving average.
The close is currently below its 90 period moving average.
The close is currently below its 30 period moving average.
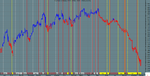
Euro Dollar / US Dollar(EURUSD)
Analysis of activity through 29/07/14
Last price: 1.3438
The current trend is down and all orders on the short side may be considered. The current market price activity is Strongly Bearish and suggests favorable trade opportunities on the short side.
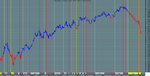
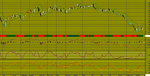
If already holding short positions, we would look to take partial profits at any retracement to 1.3549. Traders with remaining short positions after profit taking should consider placing exit stops in the region of 1.3640. Be prepared for a potential short term price pull back to the 1.3504 area.
Suggested standing placement of fail-safe stops...
If Long -- exit all contracts at ... 1.3422
If Short -- exit all contracts at ... 1.3650
VIT Daily Analysis
Review of Euro Dollar / US Dollar (EURUSD)
as of 29/07/14
Volatility Analysis
On 29/07/14, Euro Dollar / US Dollar last price up 0.0001 at 1.3438
Period Statistical Change
10-period 3.0348 -0.27
21-period 3.3426 -0.38
39-period 4.0561 -0.01
90-period 4.2463 -0.01
Bollinger Bands are 35.97% wider than normal.
Momentum Indicators
Stochastic Oscillator
The Stochastic Oscillator is 12.9053. This is an oversold reading. Monitor for reversal signal when the Oscillator crosses above 20. The last signal was a buy 15 period(s) ago.
Relative Strength Index (RSI)
The current value of the RSI is 30.35.This is not a topping or bottoming area. The last signal was a buy 1 period(s) ago.
Commodity Channel Index (CCI)
The current value of the CCI is -97. This is not a topping or bottoming area.The last signal was a buy 0 period(s) ago.
MACD Momentum Indicator
The Moving Average Convergence/Divergence INDICATOR (MACD) crosses its 9 period signal line which triggers a sell 13 period(s) ago.
Trend Analysis
Aroon
There were no Aroon signals generated today. The last signal was a Buy 60 period(s) ago.
Directional Indicator
There were no Directional Indicator signals generated today. The last signal was a Buy 229 period(s) ago.
MACD Trend Signal
There were no MACD Trend signals generated today. The last MACD Trend signal was a Sell 10 period(s) Ago.
Stop and Reverse (SAR)
There were no SAR signals generated today. The last signal was a Sell 10 period(s) ago.
Summary
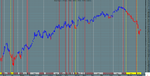
The current market condition for Euro Dollar / US Dollar is: Very Bearish
The close is currently below its 200 period moving average.
The close is currently below its 90 period moving average.
The close is currently below its 30 period moving average.
Euro Dollar / US Dollar(EURUSD)
Analysis of activity through 29/07/14
Last price: 1.3438
The current trend is down and all orders on the short side may be considered. The current market price activity is Strongly Bearish and suggests favorable trade opportunities on the short side.
If already holding short positions, we would look to take partial profits at any retracement to 1.3549. Traders with remaining short positions after profit taking should consider placing exit stops in the region of 1.3640. Be prepared for a potential short term price pull back to the 1.3504 area.
Suggested standing placement of fail-safe stops...
If Long -- exit all contracts at ... 1.3422
If Short -- exit all contracts at ... 1.3650