Martin Kay
Well-known member
- Messages
- 429
- Likes
- 0
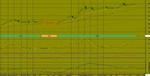
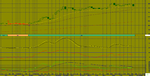
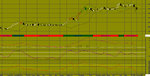
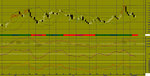
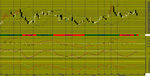
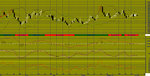
USD/JPY WEEKLY as of Monday, 10 August, 2015
*** Intra-Weekly Trading Strategy: BUY US Dollar / Japanese Yen
Buy Target: 124.9167
Enter New BUY on OPEN and exit BUY positions at Target price or at Stop price.
(NOTE: Adjust Stop Loss Price according to your trading risk.)
Do not reverse after exiting. This is a recommendation for INTRA-DAY TRADING only!!!!!
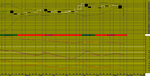
A white body has formed as prices closed higher than open.
The previous 10 candlestick bars, there are 7 white candles versus 3 black candles with a net of 4 white candles.
The previous 50 candlestick bars, there are 34 white candles versus 16 black candles with a net of 18 white candles.
A long upper shadow has formed. This is typically a bearish signal (particularly when it occurs near a high price level, at resistance level, or when the security is overbought).A spinning top has formed which is a candle with a small real body. Spinning tops identify a session in which there is little price action as defined by the difference between the open and the close. During a rally or near new highs, a spinning top can be a sign that prices are losing momentum and the bulls may be in trouble.MACD is BEARISH as the MACD is below the signal line.
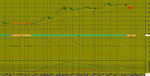
The MACD crossed below the signal line 5 week(s) ago. Since the MACD crossed the MACD moving average, US Dollar / Japanese Yen's price has increased 1.16%, and has been fluctuating from a high of 125.057 to a low of 120.412.
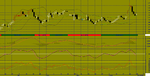
The MACD is currently not in an Overbought/Oversold range.
There have been no divergence signals during the last 5 periods.
No Stochastic Buy or Sell signals generated today. The last signal was a Sell 143 Week(s) Ago.
The RSI is not currently in a topping (above 70) or bottoming (below 30) range. A buy or sell signal generated when the RSI moves out of an overbought/oversold area. The last signal was a Sell 8 week(s) ago.
Currently the RSI does not show any Failure Swings. The RSI and price of US Dollar / Japanese Yen are not diverging.
Currently, the Momentum Oscillator does not show an overbought or oversold condition.
The last Directional Movement Indicators (DMI) signal was a SELL 98 week(s) ago.
There were no SAR signals generated today. The last SAR signal was a Sell 4 week(s) ago.
The close is currently
ABOVE its 200 weekly moving average
ABOVE its 50 weekly moving average
ABOVE its 20 weekly moving average
The current market condition for US Dollar / Japanese Yen is Very Bullish
US Dollar / Japanese Yen closed below the upper Bollinger Band by 23.5%. Bollinger Bands are 0.26% wider than normal. The current width of the Bollinger Bands (alone) does not suggest anything conclusive about the future volatility or movement of prices.
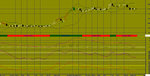
*** Intra-Weekly Trading Strategy: BUY US Dollar / Japanese Yen
Buy Target: 124.9167
Enter New BUY on OPEN and exit BUY positions at Target price or at Stop price.
(NOTE: Adjust Stop Loss Price according to your trading risk.)
Do not reverse after exiting. This is a recommendation for INTRA-DAY TRADING only!!!!!
A white body has formed as prices closed higher than open.
The previous 10 candlestick bars, there are 7 white candles versus 3 black candles with a net of 4 white candles.
The previous 50 candlestick bars, there are 34 white candles versus 16 black candles with a net of 18 white candles.
A long upper shadow has formed. This is typically a bearish signal (particularly when it occurs near a high price level, at resistance level, or when the security is overbought).A spinning top has formed which is a candle with a small real body. Spinning tops identify a session in which there is little price action as defined by the difference between the open and the close. During a rally or near new highs, a spinning top can be a sign that prices are losing momentum and the bulls may be in trouble.MACD is BEARISH as the MACD is below the signal line.
The MACD crossed below the signal line 5 week(s) ago. Since the MACD crossed the MACD moving average, US Dollar / Japanese Yen's price has increased 1.16%, and has been fluctuating from a high of 125.057 to a low of 120.412.
The MACD is currently not in an Overbought/Oversold range.
There have been no divergence signals during the last 5 periods.
No Stochastic Buy or Sell signals generated today. The last signal was a Sell 143 Week(s) Ago.
The RSI is not currently in a topping (above 70) or bottoming (below 30) range. A buy or sell signal generated when the RSI moves out of an overbought/oversold area. The last signal was a Sell 8 week(s) ago.
Currently the RSI does not show any Failure Swings. The RSI and price of US Dollar / Japanese Yen are not diverging.
Currently, the Momentum Oscillator does not show an overbought or oversold condition.
The last Directional Movement Indicators (DMI) signal was a SELL 98 week(s) ago.
There were no SAR signals generated today. The last SAR signal was a Sell 4 week(s) ago.
The close is currently
ABOVE its 200 weekly moving average
ABOVE its 50 weekly moving average
ABOVE its 20 weekly moving average
The current market condition for US Dollar / Japanese Yen is Very Bullish
US Dollar / Japanese Yen closed below the upper Bollinger Band by 23.5%. Bollinger Bands are 0.26% wider than normal. The current width of the Bollinger Bands (alone) does not suggest anything conclusive about the future volatility or movement of prices.