Marc Rivalland - Swing Trading

Hi Ash,

Don't worry about sticking a spanner in the works, all comments are welcome.

Last year was a bad year for the method, the method is essentially a trend following method and the market was very range bound last year. I wouldn't advise using the method as your only trading strategy, but I find that it is a good complement. I've found that the SPX can wipsaw a bit, but when it moves it tends to make up the ground that it lost, but it's certainly difficult to sit through losing persiods. The main thing I find is to be comfortable with the market that you are trading, I don't trade the CAC because personally I am not happy with the way it moves, so I would constantly be second guessing.

Using a filter might work, personally I have found that filters tend to lose as many good trades as bad ones, but I haven't studied the idea properly though, so I wouldn't count it out.

maybe you could put up some charts of situation where you think the method hasn't worked and we can all discuss them?

Cheers, Dan
 
Hey Dan,thanks for the reply.Yeah sounds like a good idea.Also if your interested maybe we could post up coming trades if you dont mind.I dont mind kicking it off with the next available trade in the american indices and the ftse.Maybe giving reasons not to enter as well.Marc Rivalland is saying that the RSI is too high on the ftse to take a trade on or at least to be careful.
 
Yeah, that's a good idea. There aren't any yet as all of the indicies have taken off again without giving us a signal. That's one of the frustrating things about this method, it seems to take a while to be able to get on board a trend, but the patience does pay off in the end.
 
Yeah i know exactly what ya saying but I must admit I do like that kind of approach if I could get it to work.The best part of this would be the long position that you'd still be in the market on the Nasdaq when it broke the last swing high at 1551,you really wouldnt need to worry about days waiting to get in the market as youd be a good 70 odd points up already.
 
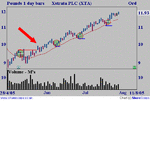
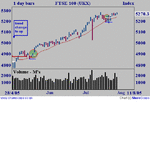
I use somthing very much akin to MR's approach on uk shares (carefully selected example attached :cheesy: ). I tried a range of filters but, as dan says, the vast majority didn't make much difference - I was left with a couple that do though although I'm sure you'll excuse me if I don't explain them ;) . I don't use on the index but attach the last couple of ftse signals as I see them.

good trading

jon
 

Attachments

  • xta.gif
    xta.gif
    8.8 KB · Views: 611
  • ftse.gif
    ftse.gif
    9.7 KB · Views: 521
Can I ask what where your stop would be on that kind of trade.Would it be based on a percentage of the market or at the previous swing low which MR doesnt recommend as too large.
 
I generally stop out at the best I can get after a close below the low of the swinglow bar. For shorter term trades a straight mechanical stop a few points below the low of the swinglow bar.
 
Cheers for the charts Jon, the current FTSE trade was technically stopped out as your chart shows, but I kept it alive because the move was a counter trend news spike and I like to fade them. But it does show the infrequency of signals in the indecies. I was also especially frustrating at the end of June to see the FTSE just miss a signal by one day only to make a fantastic rally of about 200 points!

As you say Jon, the charts do look carefully chosen, the patterns aren't always so clear or profitable. It's a very good method though.
 
danfreek said:
........... I was also especially frustrating at the end of June to see the FTSE just miss a signal by one day only to make a fantastic rally of about 200 points........

dan

out most of the day so just seen. frustrating, maybe, but you'd have still been in from the earlier signal so all you'd have lost was a possible addition?

jon
 
Well, I would have been, but I follow Marc's advice to use a 100 point profit target for the FTSE, so I wasn't. But technically there's no reason that I shouldn't have still been long.
 
dan

mmm, i suppose 100 points a pop isn't bad but since the signals are infrequent i wonder if at least a part position should be in for the long haul? only thinking out loud, as i've said i don't trade ftse very often.

good trading

jon
 
yeah, I mentioned partial profits and a trailing stop to Marc, from what I remember I think his reply was something along the lines of "If it works then use it, I just use what I have found works, it may not be the best method out there, so use whatever you find works best" So it's definately worth discussing exit strategy for this method.
 
vocalist said:
Hey Dan,thanks for the reply.Yeah sounds like a good idea.Also if your interested maybe we could post up coming trades if you dont mind.I dont mind kicking it off with the next available trade in the american indices and the ftse.Maybe giving reasons not to enter as well.Marc Rivalland is saying that the RSI is too high on the ftse to take a trade on or at least to be careful.

I too saw on Marc's website that the 5 week RSI on the FTSE was showing overbought, but when I set my RSI indicator to 25 days and 35 days it was showing 60+ which doesn't seem overly high. Is a 5W RSI different to a 25/35days RSI?!
 
barjon said:
I use somthing very much akin to MR's approach on uk shares (carefully selected example attached :cheesy: ). I tried a range of filters but, as dan says, the vast majority didn't make much difference - I was left with a couple that do though although I'm sure you'll excuse me if I don't explain them ;) . I don't use on the index but attach the last couple of ftse signals as I see them.

good trading

jon


That last FTSE signal was a potentially very good one. I entered on that at 5,235 but was unlucky to get stopped out the next day with the second terrorist scare that sent the FTSE briefly below the swing low....
 
Hi Kensitp,

I too saw on Marc's website that the 5 week RSI on the FTSE was showing overbought, but when I set my RSI indicator to 25 days and 35 days it was showing 60+ which doesn't seem overly high. Is a 5W RSI different to a 25/35days RSI?!

It’s not the same thing at all!

You should see this if you take a look at the charts I've attached below.

HTH

Cheers

Mayfly
 

Attachments

  • FTSE 100_Wkly.gif
    FTSE 100_Wkly.gif
    22.6 KB · Views: 445
  • FTSE 100_Daily.gif
    FTSE 100_Daily.gif
    20.5 KB · Views: 392
  • FTSE 100_Daily_25periodRSI.gif
    FTSE 100_Daily_25periodRSI.gif
    19.6 KB · Views: 389
Mayfly said:
Hi Kensitp,


It’s not the same thing at all!

You should see this if you take a look at the charts I've attached below.

HTH

Cheers

Mayfly

Hi Mayfly,

Many thanks for that, I understand now. I've set my charts to weekly and set the RSI to 5 and I get the same graph! How do you find the Updata package for Swing charts, is it good? Does it also identify complex swing highs/lows?
 
kensitp said:
I too saw on Marc's website that the 5 week RSI on the FTSE was showing overbought, but when I set my RSI indicator to 25 days and 35 days it was showing 60+ which doesn't seem overly high. Is a 5W RSI different to a 25/35days RSI?!

I don't use the same indicators as Marc, they aren't a nesseary part of the core method, they just seem to raise the profitability in his experience. M indicators were overbought though, so I didn't disagree with MArc, but rather than not taking the trade I simply used a more cautious approach, including a reduced position size.
 
How do you find the Updata package for Swing charts, is it good? Does it also identify complex swing highs/lows?
Hi Kensitp,

You set them up in anyway you want to and this includes all of Marc Rivalland’s modifications to Gann’s method of swing charting. The attached chart shows the example of a complex swing high combined with an outside day that Marc Rivalland used on page 43 of his book.

HTH

Cheers

Mayfly
 

Attachments

  • FTSE 100_MR_Book.png
    FTSE 100_MR_Book.png
    24.8 KB · Views: 575
Top