Making Money Trading

Which market do you want to learn to trade?


  • Total voters
    101
  • Poll closed .
Status
Not open for further replies.
Yeah, it's called "enter and pray" ;)

I wonder who his god is then? He obviously likes him!!!
I'm really curious though for a couple of reasons:

1. He must be so in tune with the markets to make money by 'feel'. At such a young age where did he learn this feel? If he's 18 then not a Grad? I thought the banks only took Grad's?
2. I take it that the spreads are favourable as Jo Public would get killed scalping all the time for small ticks on the bid/offer spread?!

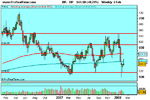
I missed the pin on the swing high that you mentioned as I was in the Gym. The pin I entered on had been a winner but when I returned from the gym I found it had plummeted again and taken out my entry stop. This is why I think 15mTFs could be successfully traded, it's just it ties you to the screen more. I could have taken profits and then reversed off that strong 61 fib etc and made money on the way down. I'm not disheartened tho as that would be emotional! I see it as part of the learning process. And I still have a bit of that to do!! Trouble is as well, IG's min bet on Gold is £10 pp, so it can be costly. I may look at another provider who allows a smaller bet pp on gold.


Good luck with it all. Must be a dream come true? I was wondering the other day though. Now you are a 'pro' does your company/fsa still allow you to write on here ?
When does your information cross the muddy boundaries of corporate only knowledge/inside info etc, or is it purely a 'trading only' company that sees the same as everyone else? It seems odd that you are barred from SB's just on the basis of being a professional?
Grim
 
Last edited:
Hi Vince,

First off lets look at the pin bar itself (see chart)

If you are unsure whether a pin is a good one remember to ask yourself THREE questions. You want to be able to answer YES to all of them.

1. Does it have a long nose in proportion to its body?

The range of the whole bar (high to low) is $10.65 and the range of the body is $2.53. Therefore the size of the body is just under 25% of the range of the bar. That is just about acceptable.

2. Does it have its close within the range of the previous bar and near to the previous bars high or low?
Yes

3. Does it have its body in the top or bottom third of the range?

The range is $10.65.

$10.65 / 3 = $3.55

The high of the daily range is $912.55.

So $912.55 - $3.55 = $909

So we want to see the close (which is the low of the candle body) above $909.

Unfortunately the close was $903.40 so the pin bar has FAILED To meet this criteria.

Now of course after time you get to know whether these pin bars are good enough to take without doing the calculations I have done above but this is simply for illustration.

Of course the pin bar itself is only HALF the story. What is important is WHERE the pin bar occurs.

Lets have a look at that next:

Support/Resistance Pivots

There is no significant s/r pivot.

Fib Levels

The "pin" hits the 50 fib from the last swing low. This is good.

Would the order have even been triggered?

You should be entering on a BREAK of the previous days high NOT in anticipation of it. As you can see from my chart, the high has not been broken so even if the setup was perfect, a position would still not be taken.

Summary

I hate to say it but this looks like a very weak setup and not one I would have taken.

That doesn't necessarily matter. Gold is in an uptrend and you are buying a retracement. You may find yourself bailed out by the trend on this one. But to clarify, the pin is not a good one, there is no real pivot and the previous days high has not been taken out. All you have is a fib level and the trend. It may be enough but "may" is not a situation I would like to put my money behind.

Good luck.

Hi Vince,

Well, what can I say? My maths is truly awful. Pelzar tells me this on a daily basis.


Out by a full $10 too. LOL. That is shameful.


Not at all - I appreciate it.


Again - well spotted. It is marginally lower. I examined it visually rather than checking the numbers and it looked fine.


Funny how I got the maths so wrong but our conclusions are basically the same.


I didn't like the look of it immediately because I thought the body was too low down the bar. This is the concept that I tried to explain with the maths. In an ideal world you want to see the body close to the top of the range with hardly any wick above it. Go back through this thread and look at the J16 thread too and familiarise yourself with the pin bars that are posted. Over time you can identify good ones by sight instantly.


THIS IS VERY IMPORTANT: You should ALWAYS look for the pin bars to hit s/r pivots, fib levels, moving averages and any OTHER supporting factors you are familiar with. This is true even on the DAILY timeframe.

The key point is that it is not the pin bar that makes the money it is where it occurs.

If you play these bars when they are well supported then you will find they have a very high probability of working.

The confusion probably arises because from time to time I enter a pin bar at a swing low or a swing high where there is NO additional support for taking it. I would like to make it clear that I only like to do this in trending markets that show an EXTREME move in one direction that culminates in the bar. In this scenario the pin bar represents an exhaustion spike upwards and indicates distribution and possibly the final throes of a trend. Your daily pin bar on gold does not fulfill this criteria.

I hope this helps.

Tom


Thanks for the feedback Tom.

I feel I'm beginning to make real progress in understanding your method - in particular, I hope others new to this type of FX trading (or trading in general) are learning too.

I accept your point on the Daily TF entries - I'll try to find pinbars with appropriate supporting info ie Fibs, S/R, etc. I took your random "I'm happy to enter on the EOD without other confirmations"-esque comment as Gospel (apologies for mis-quoting you.)

My only regret - an emotion that a trader should learn to control, but appropriate in this instance to mention - is that I didn't learn this method 4 years' ago when I first entered the world of spreadbetting (in Feb 2004).

Seriously, I re-read the real Mr Stanzione's course over the weekend after the Ireland-Italy game (a coincidence, given his surname!!) & the naivieté of his advice beggars belief. ..

The statement "there's a fool in every market & if you don't know who it is, it's you" struck me like a train afterwards.

Thanks again for all your help,

Conor

PS Can we now expect a "Make Money by Entering & Praying" thread from Pelzer??:cheesy:
 
1. He must be so in tune with the markets to make money by 'feel'. At such a young age where did he learn this feel? If he's 18 then not a Grad? I thought the banks only took Grad's?

I'll let Pelzar answer this himself although I will say he's not a grad and we don't work for a bank.

2. I take it that the spreads are favourable as Jo Public would get killed scalping all the time for small ticks on the bid/offer spread?!

Very favourable...


I was wondering the other day though. Now you are a 'pro' does your company/fsa still allow you to write on here ?
When does your information cross the muddy boundaries of corporate only knowledge/inside info etc, or is it purely a 'trading only' company that sees the same as everyone else?

I really don't know the rules. Perhaps I better find out...

It seems odd that you are barred from SB's just on the basis of being a professional?

Are you?!
 
I wouldn't take a setup on the 15m that had no SR level or fib support.

Interestingly enough, the pin bar at the swing high on your chart caught my attention.

Its directly off the 61 fib from the swing low and has an s/r pivot (exclusive to the lower TFs) coming in as resistance not far above it.

That would have made a good trade.

Tom,
Thanks again for posting the MT4 chart. When I compared it with mine from ProRealtime, the pins seem a lot better defined on your charts that mine. I may start using NFinance's MT4 feed for signals and then trade with IG. I have also learnt from that chart that I have been going too far back on the TFs for my Fib levels. The pin you mentioned was not on my Fibs as I'd been setting them off the major moves on the daily chart high/lows over 1/5 years.
I take it that a Fib should only be used within a current day or high low of the immediate TF for better accuracy then?

Grim
 
Last edited:
Tom,
Thanks again for posting the MT4 chart. When I compared it with mine from ProRealtime, the pins seem a lot better defined on your charts that mine. I may start using NFinance's MT4 feed for signals and then trade with IG. I have also learnt from that chart that I have been going too far back on the TFs for my Fib levels. The pin you mentioned was not on my Fibs as I'd been setting them off the major moves on the daily chart high/lows over 1/5 years.
I take it that a Fib should only be used within a current day or high low of the immediate TF for better accuracy then?
Grim

You are right to have the fibs set off the major moves but these will really only be best for daily and higher TF setups.

You can fib intraday too and if you are using the 15m TFs then that is probably your best bet. Fib off the major swings throughout the day or over the last few days on the required TF.
 
Since TD's at a prop house trading the company's money, I expect that he doesn't need the SII Certification (SFA) to trade.

I would expect that a financial disclaimer would be in order :LOL:
 
superspurs,

I am calling you out!!

No seriously, can you please update us on the proposed trade you discussed with T_D earlier today, when/if it eventually breaks out?

No hassle if time constraints prevent you from doing so.

In the meantime, I'm off to bed. Absolutely wrecked & the "reality" of the day job beckons in the morning.

I promise to do a step-by-step discussion of the next pin-bar trade I take on - hopefully, with a bit more success & without the need for T_D to destroy dozens of cyber-trees in correctly my mistakes.

Rest assured though - I won't hijack the thread the way Lurker did :p
 
I'll let Pelzar answer this himself although I will say he's not a grad and we don't work for a bank.

I really don't know the rules. Perhaps I better find out...


Are you?!

TD
The pro user SB bit I may have confused. At IG if you are a Pro they mark your account as such. What difference it makes I don't know? I guess they offer bigger margains etc? Not sure? I just recall having to tick a box before, saying I was a non-professional public user. Sorry if I spooked you or gave out duff gen!
Grim :innocent:
 
Superspurs, let me ask you a question in turn. Are you able to use measured moves for profit taking with a good degree of success?

never tried it before,but when asked the question it made me think what would i want out of this trade,measured move is over 25% downside,seems a bit to much,if triggered will manage accordingly.
 
A cracking read

Trader_Dante,

Thank you very much for not only taking the time to share your ideas with everyone, but also for doing so in such a clear and patient manner.

It has taken me over a week to read from start to finish, and I think I've followed it fairly well, but I have a couple of questions:-

1) You put your s/r and fib lines on a chart BEFORE looking for a "pin" bar. Do your daily TF lines stay at the same value when you move into the hourly, or do they adjust with the TF? On my charting software, if you place the cursor on the horizontal axis to draw a s/r line on daily TF it will stay at the same value. If, however, you draw the horizontal line using a high/low of a candle on daily TF, the line will move when you move the chart in to hourly view.

2) How much historical data do you want to see on your chart? You touched on this earlier in the thread, but I'm still unclear. Obviously, the more info you include, the more levels there will be. This can be a blessing and a curse. If there's a breakout, an old level may point to a reversal area (or even just a pause). However you will end up with a lot of lines on the chart if you go back too far and possibly have a lot of redundant levels.

3) Finally, you also said you want a pin to hold above/below your s/r and/or fib. Do you grant any leeway with this? Is there an amount (either measured or percieved) by which you will allow these to be broken by the tip of the pin but still take the signal? What I think I mean by this is that you said s/r lines are seen differently by each individual - do you ever question whether you are slightly out with yours and take the signal anyway?

Once again, thanks for everything you are doing here.

Good luck with the trading.
 
Hi eastieboy,

Thanks for your message.

1) You put your s/r and fib lines on a chart BEFORE looking for a "pin" bar. Do your daily TF lines stay at the same value when you move into the hourly, or do they adjust with the TF? On my charting software, if you place the cursor on the horizontal axis to draw a s/r line on daily TF it will stay at the same value. If, however, you draw the horizontal line using a high/low of a candle on daily TF, the line will move when you move the chart in to hourly view.

The daily lines stay at the same value as when I draw them. This is irrespective of the TF I look at them on.

2) How much historical data do you want to see on your chart? You touched on this earlier in the thread, but I'm still unclear. Obviously, the more info you include, the more levels there will be. This can be a blessing and a curse. If there's a breakout, an old level may point to a reversal area (or even just a pause). However you will end up with a lot of lines on the chart if you go back too far and possibly have a lot of redundant levels.

I don't have a specific amount. I usually go back as far as 2 years on the daily TF. It depends on my plan of attack though. Recently I was watching the Soybeans carefully and went right back to the contract inception to find the important levels (all time highs etc)

3) Finally, you also said you want a pin to hold above/below your s/r and/or fib. Do you grant any leeway with this? Is there an amount (either measured or percieved) by which you will allow these to be broken by the tip of the pin but still take the signal? What I think I mean by this is that you said s/r lines are seen differently by each individual - do you ever question whether you are slightly out with yours and take the signal anyway?

This is very discretionary. Generally I don't like to see levels penetrated by anything more than a few ticks. The same number goes for moves that stall above/below the pivot.
 
Entry: Pin was a bit 'recessed' but has some good potential resistance above its nose tip and a level just underneath it I thought might attract some sellers due to the low of the opposit pin at the beginning of last week... might have been better to avoid because of this possible area underneath ? ... I figured if it goes, this level could give it an extra push.

Exit: I usually check the charts at 11am 3pm 7pm 11pm. This time I checked half way through a bar and noticed it bouncing off 1.9600 Also noticed that Ide missed an opposite pin bouncing off 1.9700 earlier where I almost certainly would have closed the position, and felt a bit lucky to still be in it down at the first target area. Dont look gift horses in mouths etc.

On the plus side I dont seem to have been leaving trades on for so long they turn right back around lately, but might be swinging the other way and taking them out a bit too early maybe. Still more gained than risked so thats good, although it was only 0.01 lots :)
 

Attachments

  • gbpusd.gif
    gbpusd.gif
    16.4 KB · Views: 400
Ok. Thanks very much.

I don't have a specific amount. I usually go back as far as 2 years on the daily TF. It depends on my plan of attack though.

What do you mean by your plan of attack?
 
Last edited:
Ok. Thanks very much.


What do you mean by your plan of attack?

It's just a phrase. Trading is a battle of wits between buyers and sellers and I am talking about my plan going into that battle.

Am I looking for a swing trade in the direction of the longer term trend or am I predicting a trend reversal at a new high?

Sometimes I get a signal to reverse with a huge stop in a market I am largely unfamiliar with.

An example of this was a recent daily pin bar at an all time high in Soybeans.

When I see this kind of situation I like to get up to date on the fundamentals and the wider technical picture so I am fully prepared for any change in sentiment. That means noting areas of all time highs, all time lows, seasonal patterns, news, weather and whatever else effects the market.
 
Last edited:
T_D,

You fancy any markets for pinbars at the moment?

Plan to have a thorough look through my charts later on - although the lure of the soccer tonight may put paid to that:cheesy:

Cheers,

VS
 
T_D,

You fancy any markets for pinbars at the moment?

Plan to have a thorough look through my charts later on - although the lure of the soccer tonight may put paid to that:cheesy:

Cheers,

VS

No pin bars but there are some very interesting developments afoot in some markets.
 
Daily Soybean

There appears to be a good looking pin on the daily Soybean, see attached chart. As it is at all time highs there is little else supporting it. For me it's looks good. The only concern is that at the entry you would be shorting straight into the S/R at 1311. The low of the bar is 1316. Based on 1 pip below entry plus spread you're looking at entering at 1313.

Q for TD or anyone else to comment. Would you see this S/R at 1311 that i identified as a risk or not?

You can see that a pin occured on 14 Jan? It was a 45 pip pin. probably would have got taken out by the 2 bar pin that occured on the 23rd and 24th of Jan for a +50 trade. Just over 1:1.

Cheers,

Glen
 

Attachments

  • Soybean.doc
    83 KB · Views: 317
regarding the BP pin i put up last night,i pulled the order when i had a look at the weekly charts and lo and behold,what would i have been selling into.gonna watch footie now catch you all later
 

Attachments

  • BP4.png
    BP4.png
    8.1 KB · Views: 399
There appears to be a good looking pin on the daily Soybean, see attached chart. As it is at all time highs there is little else supporting it. For me it's looks good. The only concern is that at the entry you would be shorting straight into the S/R at 1311. The low of the bar is 1316. Based on 1 pip below entry plus spread you're looking at entering at 1313.

Q for TD or anyone else to comment. Would you see this S/R at 1311 that i identified as a risk or not?

I noticed this too.

Have you had a look at the Corn chart?

Similar setup in that you have a spike high. The price is then pushed back down forming what looks like a double top.

In Corn you have the added factor that todays session is a bearish outside bar and there is no immediately obvious support on the daily TF.
 

Attachments

  • corn.gif
    corn.gif
    13.6 KB · Views: 637
I noticed this too.

Have you had a look at the Corn chart?

Similar setup in that you have a spike high. The price is then pushed back down forming what looks like a double top.

In Corn you have the added factor that todays session is a bearish outside bar and there is no immediately obvious support on the daily TF.

TD, ok yeah i see it. Good call. Mine looks a little different. See attached. Mine does not have the bearish outside bar? Am i right? The body of today's bar does encompass the previous days bar. Or are you looking at the entire bar?

So as a prefered trade you would look to the Corn for a trade? In terms of the 2 i still like the Sotbean as the market moves into the pin strongly whereas on my corn chart it kind of meanders into it. Make sense? Just a thought.

Q. The fact that my potential entry on the Soybean is so close to the support. Could one not place a sell just below this support? Say for example instead of the entry at 1313 (off the pin) put it in 1 or 2 points below the support at 1310 or 1309? You'd be giving up an extra 4 points which is very minimal. Have you ever done this?

Glen
 

Attachments

  • Corn 06-02-08.doc
    86 KB · Views: 287
Status
Not open for further replies.
Top