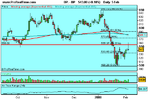
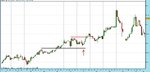
Based on what I believe to be an EOD pin-bar on the Gold Spot Daily chart, I've gone long at 912.56, with a TP of 936.76 & a sl of 891.89 (Volume of 1.00)
This is my first trade using T_D 's approach.
I executed the this trade with a complete lack of emotion - this should bode well for future trades using this method.
Thoughts anyone? Good, bad or indifferent??
Constructive feedback required!!
Hi Vince,
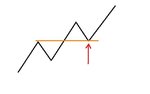
First off lets look at the pin bar itself (see chart)
If you are unsure whether a pin is a good one remember to ask yourself THREE questions. You want to be able to answer YES to all of them.
1. Does it have a long nose in proportion to its body?
The range of the whole bar (high to low) is $10.65 and the range of the body is $2.53. Therefore the size of the body is just under 25% of the range of the bar. That is just about acceptable.
2. Does it have its close within the range of the previous bar and near to the previous bars high or low?
Yes
3. Does it have its body in the top or bottom third of the range?
The range is $10.65.
$10.65 / 3 = $3.55
The high of the daily range is $912.55.
So $912.55 - $3.55 = $909
So we want to see the close (which is the low of the candle body) above $909.
Unfortunately the close was $903.40 so the pin bar has FAILED To meet this criteria.
Now of course after time you get to know whether these pin bars are good enough to take without doing the calculations I have done above but this is simply for illustration.
Of course the pin bar itself is only HALF the story. What is important is WHERE the pin bar occurs.
Lets have a look at that next:
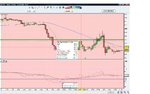
Support/Resistance Pivots
There is no significant s/r pivot.
Fib Levels
The "pin" hits the 50 fib from the last swing low. This is good.
Would the order have even been triggered?
You should be entering on a BREAK of the previous days high NOT in anticipation of it. As you can see from my chart, the high has not been broken so even if the setup was perfect, a position would still not be taken.
Summary
I hate to say it but this looks like a very weak setup and not one I would have taken.
That doesn't necessarily matter. Gold is in an uptrend and you are buying a retracement. You may find yourself bailed out by the trend on this one. But to clarify, the pin is not a good one, there is no real pivot and the previous days high has not been taken out. All you have is a fib level and the trend. It may be enough but "may" is not a situation I would like to put my money behind.
Good luck.