You are using an out of date browser. It may not display this or other websites correctly.
You should upgrade or use an alternative browser.
You should upgrade or use an alternative browser.
Making Money Trading
- Thread starter trader_dante
- Start date
- Watchers 334
- Status
- Not open for further replies.
trader_dante
Veteren member
- Messages
- 4,535
- Likes
- 1,704
TD,
Your analysis is much appreciated. I was aware of the S/R pivot but had not spotted the ascending TL. There seems to be stiff resistance at around 1.1365 - a recent resistance zone and an S/R pivot back in early November. I have moved my stop to B/E. Happily this more or less coincides with the low of the most recent (and inside) bar - another tactic I've learnt from your thread 😆
Hope you'll keep this thread going for a while more - it has been of invaluable help to me.
Cheers,
NT
What a trade!
Reas
Junior member
- Messages
- 43
- Likes
- 9
Gbpusd
Moved my stop in GBPUSD to just above last hours bar.
Edit: 01:09 PM moved stop again to 2.03
Edit: 10:01 PM moved stop again to 2.0222
This trade is going very well, but i don't think it is very usefull to post al the actions i do (move of the stop).
You can see how i'm handling the exit, it is discretionary, if i think the price will not revisit a certain level (because for example it has allready done that) i will move my stop to that level.
good trades all
Last edited:
Hi,
Absolutely cracking thread.
I've got a few questions which I don't think have been answered already, so thanks in advance if anyone has time to respond.
1. One of the popular factors for selecting a *good* bullish pin bar seems to be whether its low co-incides with a confluence of Fibonacci levels from previous swings. I was wondering if people tended to use this criteria a) as a self fulfilling prophecy i.e. everyone knows about the levels so assumes everyone else will be buying or creating demand at this level b) whether anyone actually saw special significance in these particular levels 23.6, 38.2, 50, 61.8 etc. c) some other reason or d) they don't care because it just works.
2. Whether anyone has had any particular success yet using TD's methods on equities.
I have started backtesting some of the principles against the following subset of US equities for EOD trading:
- Price: $5 to $30
- 90 day average volume: > 100K
- 5 day ATR: < $1
using the following criteria to filter pin bars:
- the pin body is less than 20% of the daily range
- the pin close is within 30% of the daily high
- the pin low is less than 98% of the lowest low over the past 5 days
- the pin close is greater than yesterday's low
- the pin low forms at important support and resistance levels from the past 12 months
My exit criteria is not programmable being a subjective mixture of trailing stops at either break even points or at support or just under the previous day's low. Therefore I'm backtesting by eyeballing charts and playing the trade for real. Its a slow process so the data set is relatively small at the moment (~100 paper trades) which has returned the following results:
- out at a profit (33%) out at a loss (33%) out even (33%)
- total profit is approximately double total losses
Next step is to start investigating additional filters to improve my percentage of winners. I'm not a massive fan of indicators such as Fib or even MAs preferring to just look at price and volume. If anything ground breaking comes to light I will obviously post up my findings.
Rgrds
Richard
shadowninja
Legendary member
- Messages
- 5,524
- Likes
- 645
A heads up for you guys. Pin formed about 15 minutes ago on EUR/USD 4H chart.
Anyone jump on this? Worth about 200 pips profit...
Tom, as you'll recall I was a bit harsh with you when you started this thread, but just you certainly seem to be going great guns and doing a fantastic job of helping newbies (and others) along.
Humble pie 😱 and congrats from me ! 😉
Garry
I've just stumbled upon this thread and started to read from Page1
Very impressed with the sporting attitude !!
Great going!
Good trading all.
Regards,
Karmit
trader_dante
Veteren member
- Messages
- 4,535
- Likes
- 1,704
Hi Richard,
I would answer this question by saying that I look at these levels because in my experience I have found that price often reacts to them.
There are some people that debunk fibs and will find other reasons why price reverses at those levels. These people may show how they coincide with support or resistance levels which they say may have more to do with the reaction than a fib level.
Whatever the reason, the professionals use them so there is certainly an element of self fulflling prophecy in them.
I personally don't pay any attention to the 23.6.
I would be interested to know this too.
This criteria is only for pin bars that indicate long positions. What about pin bars that indicate a potential short entry?
This is the key. You should get as many factors in your favour as you can before you make a trade.
1. One of the popular factors for selecting a *good* bullish pin bar seems to be whether its low co-incides with a confluence of Fibonacci levels from previous swings. I was wondering if people tended to use this criteria a) as a self fulfilling prophecy i.e. everyone knows about the levels so assumes everyone else will be buying or creating demand at this level b) whether anyone actually saw special significance in these particular levels 23.6, 38.2, 50, 61.8 etc. c) some other reason or d) they don't care because it just works.
I would answer this question by saying that I look at these levels because in my experience I have found that price often reacts to them.
There are some people that debunk fibs and will find other reasons why price reverses at those levels. These people may show how they coincide with support or resistance levels which they say may have more to do with the reaction than a fib level.
Whatever the reason, the professionals use them so there is certainly an element of self fulflling prophecy in them.
I personally don't pay any attention to the 23.6.
2. Whether anyone has had any particular success yet using TD's methods on equities.
I would be interested to know this too.
I have started backtesting some of the principles against the following subset of US equities for EOD trading:
- Price: $5 to $30
- 90 day average volume: > 100K
- 5 day ATR: < $1
using the following criteria to filter pin bars:
- the pin body is less than 20% of the daily range
- the pin close is within 30% of the daily high
- the pin low is less than 98% of the lowest low over the past 5 days
- the pin close is greater than yesterday's low
- the pin low forms at important support and resistance levels from the past 12 months
This criteria is only for pin bars that indicate long positions. What about pin bars that indicate a potential short entry?
Next step is to start investigating additional filters to improve my percentage of winners. I'm not a massive fan of indicators such as Fib or even MAs preferring to just look at price and volume. If anything ground breaking comes to light I will obviously post
This is the key. You should get as many factors in your favour as you can before you make a trade.
shortorlong
Established member
- Messages
- 659
- Likes
- 28
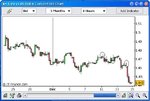
Anyone jump on this? Worth about 200 pips profit...
I don't see it on CMC chart but I do see about three others on the December chart. I wonder if anyone used them .. although I have not checked for confluence with support/ fibs.
Attachments
black bear
Guest
- Messages
- 1,303
- Likes
- 165
Huge Pin bar update/ Happy X mas & New YR all
Td
For any of your followers, prefer you to check out 1st and pass opinion :cheesy:
That ftse huge pin bar (Aug) has been tested a bit and still holding
Ftse could if it decides to play ball give a swing short term signal (1st cont of trend) on breach of Fridays High 6426 (my opinion)
I think all Fibs are pretty much lined up around the 50% but you should check them, I am not a Fiby follower. I drew them on month chart and ones from recent high down to the low on Friday (days)
Hour pin bar early ish monday or even tuesday might offer a value entry for small stakes players on the jan sb price or whatever
Volumes have been rubbish as per usual at this time of year but if it goes up it still counts.
Happy X mas and New Year TD and all on the thread, keep up the good work TD, I am warming to this thread slowly😆
feel free to dish observation if you want, I accept its a big pounce for that Cat 😱 any input welcome just noticed it and it is Christmas, you never no 😛
😱 😱 😱 all fibbys drawn on month and week chart not days as stated, my error, sorry days are on the lower one, not sure what that means :?:
Andy
Big Cats Rule 😛
Last edited:
black bear
Guest
- Messages
- 1,303
- Likes
- 165
Start again
Start again
Dec Fut
Aug month chart huge pin bar on very good volume
Pin Tested Nov
Week Pin bar 4 wks ago, pullback to the 50% fib I think :?:
A test on last weks low would line up all stars I think
You check it out TD I have confused myself 😕 again😆 😆
We need a good plan not my rubbish over to you
Andy
darshybaby
Newbie
- Messages
- 9
- Likes
- 5
hi Develbis...
Sorry am just catching up with this thread. Do you mean that it will go down to last week's lows? Do you mean as in the week before (so 6290) and then it will reverse for an Xmas rally?
Sorry if I have got the wrong end of the stick...just confused and would love to be unconfused. lol. Thanks a lot! Really appreciate it.
black bear
Guest
- Messages
- 1,303
- Likes
- 165
Me to a little, I am in the same boat
Hi darshybaby
I dont do predictions, I am not saying anything other than
Its a large pin bar followed by another in the next time frame down thats all and it seems to have or be around some Fib levels that I do not no anything about and do not trade with them. I am asking Td to take a look thats all.
I swing trade and intra day trade ftse only and follow this thread a bit thats all, I posted pin a bit back and it was ruled to large a stop, its later and possible trade set up may have more going for it this time round, I understand Td attempts entry in the 1 hr time frame
Td is the man to pass opinion = valid pin or not if its tradable or not etc
Wait for a TD to dish me and have a good X mas laugh, I may have it all upside down
Again 😆 😆
Sorry for confusion caused, but I am in same boat as you I don"t trade larger time frames and am a little interested in method, its growing on me a little
Have good X mas darshybaby
Andy
hi Develbis...
Sorry am just catching up with this thread. Do you mean that it will go down to last week's lows? Do you mean as in the week before (so 6290) and then it will reverse for an Xmas rally?
Sorry if I have got the wrong end of the stick...just confused and would love to be unconfused. lol. Thanks a lot! Really appreciate it.
Hi darshybaby
I dont do predictions, I am not saying anything other than
Its a large pin bar followed by another in the next time frame down thats all and it seems to have or be around some Fib levels that I do not no anything about and do not trade with them. I am asking Td to take a look thats all.
I swing trade and intra day trade ftse only and follow this thread a bit thats all, I posted pin a bit back and it was ruled to large a stop, its later and possible trade set up may have more going for it this time round, I understand Td attempts entry in the 1 hr time frame
Td is the man to pass opinion = valid pin or not if its tradable or not etc
Wait for a TD to dish me and have a good X mas laugh, I may have it all upside down
Again 😆 😆
Sorry for confusion caused, but I am in same boat as you I don"t trade larger time frames and am a little interested in method, its growing on me a little
Have good X mas darshybaby
Andy
darshybaby
Newbie
- Messages
- 9
- Likes
- 5
Thanks Andy! That's cleared it up somewhat 🙂, Although I think I see what you mean.
TD if you are out there...can you enlighten us please. Thanks in advance!
Have a good xmas too Andy.
TD if you are out there...can you enlighten us please. Thanks in advance!
Have a good xmas too Andy.
trader_dante
Veteren member
- Messages
- 4,535
- Likes
- 1,704
Hi,
I'm afraid the charts I use don't offer a monthly TF.
I see no reason to take a position at the current time based on any of the other TFs.
Sorry I can't be of more help.
Tom
I'm afraid the charts I use don't offer a monthly TF.
I see no reason to take a position at the current time based on any of the other TFs.
Sorry I can't be of more help.
Tom
black bear
Guest
- Messages
- 1,303
- Likes
- 165
Week Pin nose @ 50% Fib
Hi Tom
Course you can help, your the pin bar wizard 😆
Week pin nose at 50 % Fib its low been tested and a wee pull back on mon or tue could I think if an hour pin forms give an entry :?:
Or do you only do Days Tom and no higher :?: the month one I thought just backs later signal up a bit or am I way off base again, do we need to see a day pin then go down to hours
Sorry for being a pain Tom, just want to be clear & 2 Cheetahs are better than one, team work counts for plenty 😆 😆
Andy
Hi,
I'm afraid the charts I use don't offer a monthly TF.
I see no reason to take a position at the current time based on any of the other TFs.
Sorry I can't be of more help.
Tom
Hi Tom
Course you can help, your the pin bar wizard 😆
Week pin nose at 50 % Fib its low been tested and a wee pull back on mon or tue could I think if an hour pin forms give an entry :?:
Or do you only do Days Tom and no higher :?: the month one I thought just backs later signal up a bit or am I way off base again, do we need to see a day pin then go down to hours
Sorry for being a pain Tom, just want to be clear & 2 Cheetahs are better than one, team work counts for plenty 😆 😆
Andy
Attachments


lurkerlurker
Senior member
- Messages
- 2,482
- Likes
- 150
Year of GBP/JPY pin backtesting
I've backtested 21 trades from all of 2007 on the GBP/JPY using the hourly pin bars. There are some interesting stats, and I've attached a chart from most setups.
Info over at http://www.trade2win.com/boards/trading-journals/24886-trading-journey-lurker-9.html#post377682
Let me know if any of you have suggestions as to how I could improve either the backtesting or the presentation of results. Also, if any of you found this useful, please let me know and I'll post other instruments.
trader_dante
Veteren member
- Messages
- 4,535
- Likes
- 1,704
Hi Tom
Course you can help, your the pin bar wizard 😆
Week pin nose at 50 % Fib its low been tested and a wee pull back on mon or tue could I think if an hour pin forms give an entry :?:
Or do you only do Days Tom and no higher :?: the month one I thought just backs later signal up a bit or am I way off base again, do we need to see a day pin then go down to hours
Sorry for being a pain Tom, just want to be clear & 2 Cheetahs are better than one, team work counts for plenty 😆 😆
Andy
Andy,
The only tradable pin bar I see on the weekly TF occured 4 weeks ago. Any play should have been made on the initial break. In my opinion it is now far too late to try and get exposure to this.
Tom
black bear
Guest
- Messages
- 1,303
- Likes
- 165
Thanks
TD
Thanks, I will look for something more suitable for Dinner 😀
Andy
Andy,
The only tradable pin bar I see on the weekly TF occured 4 weeks ago. Any play should have been made on the initial break. In my opinion it is now far too late to try and get exposure to this.
Tom
TD
Thanks, I will look for something more suitable for Dinner 😀
Andy
shadowninja
Legendary member
- Messages
- 5,524
- Likes
- 645
I don't see it on CMC chart but I do see about three others on the December chart. I wonder if anyone used them .. although I have not checked for confluence with support/ fibs.
It was the big one in the middle: the nose was 65 pips long.
superspurs
Established member
- Messages
- 618
- Likes
- 139
dow cash
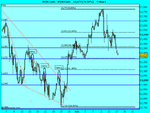
ive set an alert for the dow @ 12232 to see what happens there,reasons are it will possibly be a triple bottom also @ the 50 fib.i also think there will be bigger fish than me looking at this,we will see.i seem to be watching and waiting a lot more for PA.
ive set an alert for the dow @ 12232 to see what happens there,reasons are it will possibly be a triple bottom also @ the 50 fib.i also think there will be bigger fish than me looking at this,we will see.i seem to be watching and waiting a lot more for PA.
Attachments
Last edited:
- Status
- Not open for further replies.
Similar threads
- Replies
- 3
- Views
- 2K