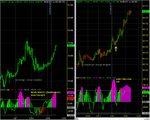
It was absolutely not trending as you can see in the chart. I have included 20-80MA and ADXR but there was no indication of a trend. It was clearly in a range.
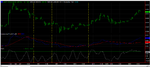
It depends upon how you look at it. Yes from 6th Dec to 15 Dec on your chart it would appear to be in a range. However at the hourly level there are what appear to be trends within that range.
If I apply the Ehler Instantaneous Trend Line on an hourly chart you will see that there are several sessions where the hourly chart was trending during the session. This is indicated by the two lines not crossing.
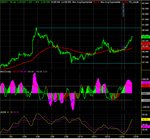
The MACCI readings of above 100 or -100 do not of themselves mean that you should go short or long. They are a warning that, if a market is in consolidation mode, that it might be edging towards the point of exhaustion. However one should look for other confirmation signals, such as MACCI turning and leaving the OB or OS regions or bar formations such as shooting candles or hammers.
For those who are not familar with MACCI, which is essentially a moving average of the CCI indicator the following link gives some further information.
http://forex.eazel.com/2006/06/16/cci-indicator/
With any inidcator it is worth going back to the basic formula and working through the calculations from scratch to see what happens to the value when the relationship between HIgh, Close, Open, Low (and volume where relevant) changes. This will confirm the circumstances in which the indicate performs well and when it does not. This knowledge will provide clues as to which other indicators or price action could be used for confirmation.
After completion of this post I now see that the price is turning down, MACCI has also turned down and exited the OB zone