MA Cross

masao

Junior member
Messages
42
Likes
0
Just a Note,

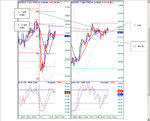
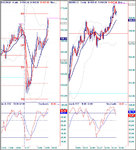
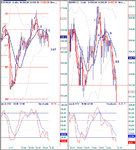
As not to get the wrong impression from this thread and everything that I've posted I want to post the screens that are directly in front of me when I trade. I'll post these below. I have 6 monitors with 2 directly in front of my face and these are on them. Several questions have been asked about the RZ averages and I will use them in certain circumstances always FX related. I came up with the RZ averages and their use to help deal with the trendiness of FX and at times I'll use these exclusively but rarely will they be directly in front of me. What I've posted below remain in front of me. I wanted to make this clear and in spite of my experimentation with other indicators relative to my method my main method screens remain up and intact.

Regards,


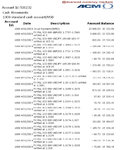
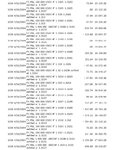
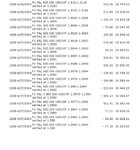
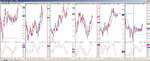
I traded an ACM demo account for 5 days to demonstrate the effectiveness of this approach. Money/Trade management guidelines were 30:1 general trade size to account equity which started at 20,000 USD with risk dictated by entry premise. Also I imposed an aggressive 5-8% of account equity as a daily goal. Results posted below.

This is a simpler follow up to a previous thread I had posted. As for the previous thread I realized it was so full of jargon that it was relatively useless to others so I pulled it. Sorry about that. This is the same methodology but focuses on the larger timeframe moving averages cross.

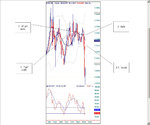
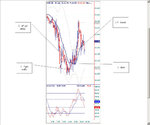
5pdw = 5 period weighted moving average
RZ5 = a moving average of the Highs and Lows of the last 5 bars and shifted up
RZ15 = a moving average of the Highs and Lows of the last 10 bars, displaced 5 bars and shifted up

For an example I'll show the 377m 5pdw/RZ5 cross down. I'm interested in a trend that respects the support or resistence of the RZ5 moving average with the notion that all of the trends in the correct timeframe will respect the RZ5. So in this case the 377m 5pdw/RZ5 cross down to initiate the downtrend shows up in the 89m RZ5/RZ15 cross and base entry short and/or a trigger entry off of the 21m RZ5/RZ15 cross/base/breakdown.

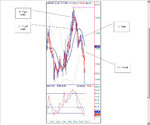
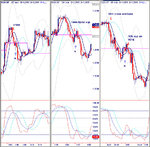
Now that's the entry off of the cross with possibly more volatility to deal with than an entry off of a blue candle in an established downtrend. If we take a look at the first blue candles in the same 377m 5pdw/RZ5 downtrend it/they show up as a 144m 5pdw cross above RZ5 and on the 89m an RZ5 cross above RZ15. In the previous thread I mentioned an mini inverse1 , well there it is in the stoch showing up in the 144m 5pdw/RZ5 cross up off of the 377m downtrend blue candle. The 144m mini inverse1 IS the 377m blue candle in the ongoing 377m downtrend.

So the main point is the up/downtrend that respects the support or resistence of the RZ moving averages follows thru nicely and with the notion that good trends respect the moving averages our risk is defined by the upper boundery of the slower moving average after being crossed which represents the higher timeframe immediate directional trend. If the boundary is breached we can make the conclusion that the move we've entered is not the kind of trade we want and not be teased into whip action and with very limited risk. If the move continues we trail the RZ15 on the correct timeframe to the cross exit which is the duration of the higher timeframe 5pdw/RZ5 trend

Note: The trades in the demo were done off of the 1 minute and 3 minute charts, and utilizing the 8, 13, and 21 minute timeframes.
 

Attachments

  • 5pdw rz5 5.jpg
    5pdw rz5 5.jpg
    206.7 KB · Views: 883
  • UGT SCRN.jpg
    UGT SCRN.jpg
    601 KB · Views: 371
Last edited:
Damn I always knew us buckeyes were some smart dudes!!! Especially those of us who live in the country! Maybe we don't have anything else to do but study charts,lol.......Ok now seriously - on the s&p contract i use 81/135/405 minute charts.......5-81's a day, 3-135's and u get the picture.......so my neighbor why 377? why 144? 8/13/21 - i'm new to currencies, that i'll admit!! by the way take a look at the weekly euro - this is week 9 and it's screaming buy!!!! ..... if you noticed, I posted an early warning 'buy' signal on the 20th or 21st here - still no confirmed buy 'signal' as of tonight. Just some serious questions - heck i haven't figured out how to post a chart here yet,lol

My best - gus
4/27/2004 @ 10:19
 
Hi gus,

Yes Oatman is spot on they're fib. I leave out the 34m on my first screen as it seemed the most expendable. Screen 1 being 1, 3, 8, 13, 21, 55 and Screen 2 being 89, 144, 233, 377, 610, and 987. I'll peek at the daily and weekly as well. It comes down to what we believe and since we are traders it's natural we believe there is a structure to price and most will agree that this structure conforms closely to fib. So for no greater reason than this I generally confine my inputs to a fib.

Best Regards,
 
Last edited:
Hey masao,

Looks impressive, may I ask you what charting package you use? I'm a complete newbie and am looking to get some decent charts for forex.

Thanks,

Tom
 
Hi tom,

This is Tradestation7www.tradestation.com The charting is great, the active forex data is good, however the historical forex data is limited. This probably wouldn't affect you if you are a method trader as I am but it may be a bit of a problem if you wish to backtest a system on forex with intraday data being a bit limited. The CME currency futures active data is good as well with the historical futures data being more extensive. Another good streaming package that's a bit cheaper is fibonacci trader from a reseller out of Australia www.fibtrader.net/ I've tried a demo of this software and if I needed a different charting package I'd go with this. The charting is great and the data was timely and generally very good. Another that I like is Prosticks www.prosticks.com which is the charting for LCG I believe and the data is hot. NetDania is free charting at www.netdania.com I hope this helps.

Best Regards,
 
Last edited:
micro 3.5 strike reversal

A 3.5 strike reversal on the 3 minute USDCHF.
 

Attachments

  • 3.5 STRIKE REV.jpg
    3.5 STRIKE REV.jpg
    134.7 KB · Views: 353
Last edited:
3.5 Strike Reversal

A 3.5 strike reversal on the 13 minute USDCZK.
 

Attachments

  • 3.5 STRIKE REV 2.jpg
    3.5 STRIKE REV 2.jpg
    132.1 KB · Views: 273
Last edited:
3.5 Strike Reversal

A 3.5 strike reversal on the 8 minute USDSEK.
 

Attachments

  • 3.5 STRIKE REV 3.jpg
    3.5 STRIKE REV 3.jpg
    135.4 KB · Views: 258
Last edited:
3.5 Strike Reversal

3.5 strike on the emini russell 2000. Notice the danger in the 8 minute chart of assuming that this reversal on the 3 minute will play out. Momentum on the 8 minute is deflecting the 5 period moving average higher and this is a setup in itself. At the moment everything is "potential" as the 8 minute is attempting to play out.

The 8 minute UGT setup does play out as the 3 minute reversal attempt failed shown in the next image. In this type of situation you would need to be able to reverse your position from short to long.

Then the potential 8m reversal breakdown triggered by the 1m 3.5 strike rev at the close of trading in the 3rd image jpg
 

Attachments

  • 3.5 STRIKE REV 6.jpg
    3.5 STRIKE REV 6.jpg
    208.3 KB · Views: 267
  • 3.5 STRIKE REV 6H.jpg
    3.5 STRIKE REV 6H.jpg
    179.5 KB · Views: 291
  • 3.5 STRIKE  ER.jpg
    3.5 STRIKE ER.jpg
    200.4 KB · Views: 268
Last edited:
Post removed

I thought this was a sales pitch, I've be told its not so please accept my apology.

JonnyT
 
Last edited:
A misunderstanding and no hard feelings. Thanks my apologies as well.

Regards,

masao
 
Last edited:
And Two Bars I really do appreciate the comment and am glad you find this thread of some interest. If you ever have any feedback that'd be great.

regards,

masao
 
Top