MA Cross

Utilizing the 3.5 strike rev off of a setup

Here's a 13m stoch setup and an 8m ma setup that could be triggered by the 3.5 strike rev on the 3m chart. This actually is a continuation and I find it interesting that it took me a moment after labeling the chart to notice that it wasn't a reversal but a continuation of the trend.
 

Attachments

  • 3.5 STRIKE REV PLAY.jpg
    3.5 STRIKE REV PLAY.jpg
    271.7 KB · Views: 310
Last edited:
Hi Maseo,

I was wondering if you had the TS2000i code
for the RZ10 when I try and validate the code you put in the tread
I get an error message.

Thanks
Ian
 
Hi ian,

The code I posted just has a bit of junk around it I tried to verify the actual code in my 2000i and it works I'll post it below. I'm getting ready to post some charts looking at the same setups but with a Donchian Channel. Remember that using any indicator or indicators is conceptual in that we all see the same price movement. So when I talk about the relationships between certain moving averages or indicators I'm not saying do this because this works. I'm talking about the relationships of price action, pattern, and indicators. A way of filtering what I see and defining what might work and then the boudaries of failure and success. As you'll see in the Donchian Channels the same setups can be traded using the high/low midline average with the 9pd highs or lows being the boundaries. I had also posted earlier a topic trading the same setup using a stochastic then I followed up with a simpler discription using what you're asking about in the moving averages, where the Donchian is more price related it may be the most effective because of the concreteness of the signals. If you haven't already check out this link to a very old method that's essentially one in the same. Floor Trader Method I like to study these setups from as many vantage points as I can not endorsing anything in particular only that this setup is reliable and has repeated itself for many years. It may not show itself everyday and that's why we need to look to gain some knowledge on abit of a macro level as well. 2000i code is below.

Regards,


var: aline(0), bline(0);

aline = ((low[1]+low[2]+low[3]+low[4]+low[5]+low[6]+low[7]+low[8]+low[9]+low[10])/10);
bline = ((high[1]+high[2]+high[3]+high[4]+high[5]+ high[6]+high[7]+high[8]+high[9]+high[10])/10);
value1 = (aline+bline)/2;
plot1 [-5](value1 + .00025);
 
SetUps using a Donchian Channel

This is an exercise in trading the same setup but with a different indicator, the Donchian Channel. Normally considered a breakout indicator but I don't care it's very price specific and I think it makes sense in these circumstances. I'll post 7 charts in all. One 8 minute chart showing the action for the entire week and monday and tuesday's 3 minute chart with the triggers for the 8m setups below. Then the rest in two posts below that, and to compare the text you'll need to keep the one 8 minute chart of the entire weeks action open as well as the thursday 3m for the thursday 1m trigger on the 3m x. setup.

regards,

PS These are breakout triggers and yes you'll have traders fading the break and I've posted another chart and topic below going over this abit
 

Attachments

  • A week.jpg
    A week.jpg
    278.3 KB · Views: 285
  • A monday.jpg
    A monday.jpg
    180.8 KB · Views: 253
  • A tuesday.jpg
    A tuesday.jpg
    173.9 KB · Views: 251
Last edited:
Donchian cont

Again to compare the charts below you'll need to open the 8m "A week" chart above and any comments are on the charts.
 

Attachments

  • A thursday x.jpg
    A thursday x.jpg
    120.6 KB · Views: 236
  • A wednesday.jpg
    A wednesday.jpg
    199.9 KB · Views: 235
  • A thursday.jpg
    A thursday.jpg
    208.5 KB · Views: 240
Main Trading Screen

1.
Just a Note,

As not to get the wrong impression from this thread and everything that I've posted I want to post the screens that are directly in front of me when I trade. I'll post these below. I have 6 monitors with 2 directly in front of my face and these are on them. Several questions have been asked about the RZ averages and I will use them in certain circumstances always FX related. I came up with the RZ averages and their use to help deal with the trendiness of FX and at times I'll use these exclusively but rarely will they be directly in front of me. What I've posted below remain in front of me. I wanted to make this clear and in spite of my experimentation with other indicators relative to my method my main method screens remain up and intact.

Regards,
 

Attachments

  • UGT SCRN.jpg
    UGT SCRN.jpg
    601 KB · Views: 305
Last edited:
Donchian Channel code

Ian,

If you're interested here is the code for the Donchian Channel. I pulled it from my TradeStation7 but I was able to verify it in my copy of 2000i as well so it should work for you. Also you "have" to format the indicator and change the scaling to "Same as symbol" and check "Use as study default".

regards,


Inputs: HiLength(9), LoLength(9), ShowAvg(True);

Value1 = Highest(H, HiLength);
Value2 = Lowest(L, LoLength);
Value3 = ( (Value1 + Value2) / 2 );

Plot1(Value1, "DonchianHi");
Plot2(Value2, "DonchianLo");
if ShowAvg = True then
Plot3(Value3, "DonchianAvg");
 
Last edited:
Donchian Strategy code

Ian,

This should work in your 2000i and please understand that these are triggers not a mechanical system.

regards,


Inputs: HiLength(9), LoLength(9), ShowAvg(True);

Value1 = Highest(H, HiLength);
Value2 = Lowest(L, LoLength);
Value3 = ( (Value1 + Value2) / 2 );

if value1 > value1[1] then buy("b") next bar on open else
if value2 < value2[1] then sell ("s") next bar on open
 
Donchian Breakout entries and Fades

The fading of breakouts is a consideration for sure but I'm not sure personally I see the profit in it in a micro timeframe, perhaps on the dailies or larger intraday time periods. But the meat between the bones on a 1min fade seems like just a suckers play and the wider timeframes should rule.
 

Attachments

  • A MON EOD.jpg
    A MON EOD.jpg
    334.8 KB · Views: 281
ianp said:
Hi Maseo,

thank you very much for the codes.


Ian

Hi ian,

You are welcome. Remember that the setup is in price it's what we all see and this stuff I have laid out is just a way of filtering price action. Please be careful in that if we percieve something about indicators that appears as simple as "when the red line crosses the blue line we trade" our thinking is off and due for an adjustment. Focus on price relative to the indicators and across timeframes as we need to differentiate what's worth the risk. My apologies ian as I don't know you're experience level and you may be very experienced and expert at trading. I'm just covering my ass abit here letting everyone know that this stuff can be hazardous as well, it's a fine line.


regards,
 
Monthly, Weekly, and Daily Openlines

For discussion

regards,
 

Attachments

  • OPLN 1.jpg
    OPLN 1.jpg
    292.4 KB · Views: 259
  • OPLN 2.jpg
    OPLN 2.jpg
    225 KB · Views: 251
Volatility Standard Deviation

For Discussion
 

Attachments

  • VOL STD DEV 0.jpg
    VOL STD DEV 0.jpg
    265.6 KB · Views: 251
  • VOL STD DEV 01.jpg
    VOL STD DEV 01.jpg
    273.4 KB · Views: 236
  • VOL STD DEV 02.jpg
    VOL STD DEV 02.jpg
    227.5 KB · Views: 256
Last edited:
Excellent posts masao - I see you've made it up to junior member! On the 5min chart I see you are using 'open line' -the purple one. I've never ploted the open line. Do you find it acts as a magnet on non trending days? Have been missing you in the chat room.
 
Hi gus and thanks,

Good to hear from you I hope everything's going well. Just a little note here about my posts. Pretty much everything I've posted on this thread is about exploring the price action behind the method I have chosen with the understanding that everyday we all sit down in front of our screens and see the same price action, setups, etc. How we choose to enter and exit can go by a thousand different names. But in the end the better we understand price action relative to our method and other methods the better equiped we are to be nimble. Granted we at some point need to tighten the screws and draw the lines but I'd say that given the right circumstances anyone can make money trading, keeping it is another story. I tend to have a blue collar mentality in that when I sit down at my desk I want to work. That doesn't work well at all in trading so I've come up with a few filters that help me push back and cool my trading. The openline is one of them. As you've seen in the thread I use multi timeframes in order to gain context on the setup relative to whether we are overall in an expansion, exhaustion, tightening, or consolidation. And if you check out the openline charts above in the thread you can see that the same goes on a macro with the openlines. So just as if I have a 60 minute 5 period moving average/ 15 period moving average downtrend with price tightening back to the 15 period moving average. And I have a rising 13 minute stochastic with a 3 minute setup/1 minute trigger long, I need to know that the 60 minute 15 period is resistance. This is where context comes in and I need to decide if there's enough room there and whether the risk is worth the reward.The same applies on the flip side and knowing when it's favorable to let the move play out. If you plot some openlines you'll see the same relationships. When the daily and weekly openlines are above the monthly, daily openline breaks above the weekly tend to playout. Daily openline breaks below the weekly and above the monthly openline tend to be abit dull this on a micro timeframe. On a macro view I'd be inclined to say generally look to buy daily red on weekly/monthly green. Look to buy weekly red on monthly/yearly green and vice versa, etc. The scenarios are too numerous for here but you get the idea. It's a context tool that I'm aware of and I'll give some weight to. Like if I were required to grade my trade like metal 1 being the weakest and 5 being the strongest I could use openlines and the context of higher timeframes to arrive at some best guess of potential. This helping me to not give up perfectly good paper profits or bail way too soon when I should have let the move play out. Take care gus.


regards,
 
Dear Masao;
I am new to this and its hard for me to understand your "forex language",and anyone's forex lingo. I think my first step should be to learn about synthax and learn basics so that I can later start charting my own moving averages right? I am a full time employee for a mortgage company and dont have much time available either. I would love to start this business part time and if I were to become a succesful trader, I would love to quit my job and do this for a living.
I read "Technical analysis applications" by Cornelius Luca and think its to broad at the end of the book you learned how to understand a candle chart and a trend reversion but you dont know where to go from there.
As soon as I finished, I opened a free demo trading account with CMS(visual trading) and I have done anything but lose "money." Before I put some real money, I want to be efficient and be convinced that I can be a good trader. I just need to learn fast and efficiently rather than reading 20 books and havent learned anything. For example, I need to be able to have the capability to graph an RZ5 and a RZ15 on a chart and learn to interpret the trends. I need something more hands on that will enable me to debelop a strategy faster. I dont even have the knowledge capacity at this point to test your trading strategy described in this forum.Is there a book that you could recommend me ...as a beginner? I have a graduate degree in Finance and Decision Support modeling that should perhaps help me pick it up fast, but for a beginner, its kind of hard.
I tried tradestation.com but you need to open an account with them to start trading, I just dont want to put any money anywhere until I feel confortable trading. They even ask for a 2 year trading history which I dont have. What options do you recommend here?
I need some mentoring here and I will appreciate your help and anyones help
Thanks so much
Eduardo Zanatti
PA-USA
 
Dear Eduardo,

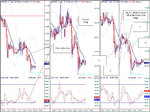
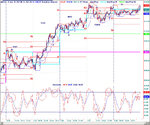
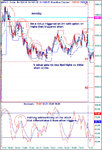
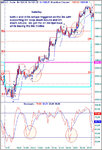
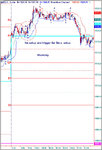
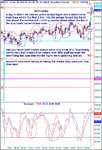
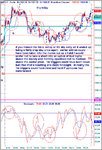
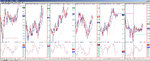
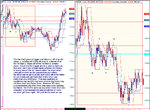
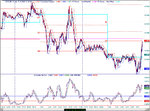
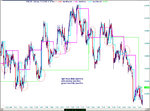
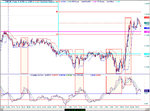
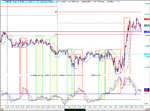
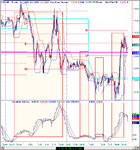
First off don't worry about the RZ averages they're just an illustration, the answers don't lie in the indicators themselves. An RZ or 5 period simple moving average, or any average or indicator can be used to make or lose money. So if you don't have access to these that's ok other tools will do it's really method that counts. And my apologies for my personal lingo it's primarily UGT but I've also adopted many abreviated terms and symbols, don't worry about them hardly anyone does understand them.

Eduardo one of the first things I would want a person to grasp is risk and that it's very real. To me personally this not only extends to my individual trade risk of death by a thousand cuts but overall risk in leverage and that I should understand that leveraging 50k or 500k in a trade carries with it two very different event risk possibilities that even though are remote still exist. And this event risk is not reflected in the margin where for 5 grand and an unforseen circumstance could put a person in fairly deep water. But this is up to the individual . In my eyes 5 mini fx contracts "roughly" equal 1 emini S&P or 1 emini Russell 2000 contract not only in the obvious size but in trading profit potential relative to volatility and is sufficient in the beginning if traded well. I know there are numerous rule of thumb calculations but for me risk needs to be heartfelt, it's like quitting smoking either you want to quit or you've decided to quit two very different mindsets. So for me I appreciate it and I don't want that pressure on top of my decisions so I prefer to consider both overall leverage risk against cash assets and trade risk against account equity. Once a trader has thought this over and decided on a level of risk that they can accept the consequences it pretty much becomes built in to the process and for me I hardly have to consciously think about it in day to day trading. A good book on this subject and one I keep on my desk is "The Trading Game" by Ryan Jones.

I'm sure from your post you will be inundated with advice of which unfortunately mine is probably no better than most. I say this because there's really no easy way to get from point a. to point b. in trading as far as I've seen. There are generally speaking phases we all go thru in trading from the very beginning to becoming well versed and experienced enough to keep some money and not lose it back to the markets. I started trading full time 8 years ago and probably now have about 15000 trades under my belt. From the beginning to where I started to hold my own a couple of years later it probably cost me $60k and this size of initial loss is not uncommon from the trenches. So do think about this and realize this is a commitment where the point of profitability is unknown as it may be 6 months or it may be 6 years. I will say that the markets have kicked the crap out of me so many times that I have very few beliefs I would label more than as a "maybe" or "potential". And that's how I look at setups day in and day out. I look for potential setups, then potential triggers, and what-if scenario's. As opposed to thinking I know something and trying to cram the market's action into my mold of what I believe should happen. Thus I'm able to stay nimble, "being nimble" is my #1 most important trading quality.

As far as getting off on the right foot and acquiring some actual usable information in book form I would recommend to you the book "Secrets of the Undergroundtrader" by Jea Yu, as a good fundamental resource. The reason I'd recommend this book and method is it's the only method I've encountered that preaches context. You'll find the same setup/triggers in other camps but not context. Understanding the context of our setup relative to the higher timeframes filters our expectations leaving us with higher odds of success. The method focuses on price action relative to moving averages and the stochastic as opposed to focusing on an indicator signal. If you get the book and want to discuss it here I'll be more than happy to however I have spent considerable time in the UGT trading pit and would recommend at some point going straight to the source with your questions.

As far as TradeStation I don't use them as a broker only my charting. I use Interactive Brokers for my emini, equity, and options trading and as for FX you can choose any number of FX dealers and get the same results. However regardless of your charting platform I would recommend that you take your data seriously as it will cost you significantly in the long run if you don't. By this I mean consider getting data that's independent of the dealers. You want good data that's active enough to give an understanding of what's going on and doesn't just fly against you.

Eduardo in summary I would recommend that you choose a "complete method" as in the Undergroundtrader book but others do exist. Take your data and charting seriously and consider getting either Tradestation http://www.tradestation.com/fees/subscription_op.shtm or Fibonaccitrader http://www.fibtrader.net/ or another top charting platform. Also try Ensign at http://www.ensignsoftware.com/ this is nice software that has a playback feature of yesterday's data for $35 bucks a month that would allow you to demo trade eminis and possibly equities on your schedule. Also Cybertrader offers a nice free simulator 24 hrs a day at http://www.cybertrader.com/overview/simulators.asp for equities. Of course you can demo your fx as you should but knowing when to trade is a big deal and trading the asian session isn't always robust to say the least. The FX demo comes down to your trading style whether micro, swing, range, trend, etc., and what asia is offering. Anything I left out or you want to ask don't hesitate, I wish I could be of more help but trading just takes time. Take care


Regards,
 
Last edited:
Masao:
Thank you very much for responding to my questions. All the information you have given me is very valuable and I appreciate very much.
I will put a lot of focus on the risk factor as per your recommendations and I will definetely buy the books you recommended.
If I work full time and I only have time do trade after 7 pm until 12 am, what timeframe and strategy do you recommend?If I were to become succesful part time taking moderate risk on my positions,what percentual return on my investment do you think I could achieve on average per year? Assuming I always follow my strategy and stick to my decision making guidelines...
Again, thanks so much for your help.
Thanks
Eduardo
 
Dear Eduardo,

These aren't my favorite types of questions as it makes me feel more like a counselor than a trader. I truly don't have the answers to becoming successful at trading. However I'll give it a shot just know to take my responses here with a grain of salt as they're just opinions.
Assuming I always follow my strategy and stick to my decision making guidelines...
I like to use the analogy of making snowfakes to describe what I believe to be the futility in a linear approach to trading. Say if several people fold paper and begin cutting in order to make paper snowflakes we can be fairly certain that each persons' creation will indeed look like a snowflake. Yet we have no idea precisely what the snowflake will look like only that it will bear the fractal characteristics caused by the folding and cutting thus looking like a snowflake. If this same notion is overlaid onto any market we could come to the conclusion that we have no idea what the future micro or macro pattern will look like only that it will resemble the fractal nature of the past. So working backward on your questions. If your strategy and decision making guidelines are geared towards taking advantage of the everchanging fractal nature of price pattern with adaptive being key then I'd say you have a good shot at success at some point in the future. But if you're lured onto any number of side roads from indicators to backtested systems that extrapolate the past into the future or thinking that discipline is the key to trading success then there may come a time when you wish you had never attempted trading. Only time will tell but your success will for the most part be dependent on the environment not your ability to trade.
what timeframe and strategy do you recommend?If I were to become succesful part time taking moderate risk on my positions,what percentual return on my investment do you think I could achieve on average per year?
I can only recommend the method I've described in this thread as it's the only method I've used in 5 years so I have relatively little experience actually trading other methods. There are many hazards in using this method, it's not easy and your success will largely depend on your ability to recognize and adapt. As far as returns I have no idea although I do know of a guy in the UGT trading pit that made 200k last year with this method. I know this because he brought it up because he had lost 200k trading other methods, so it was a big deal that he broke even. So I'm not sure what kind of a victory you would call that since his return was zero but I'm sure it felt good. Good luck Eduardo.

Regards,
 
Dear Masao:
Where do I find the UGT trading pit? What is it?
I apologize for my ignorance
Regards
Ed
 
Top