LIES, DAMN LIES, & BACKTESTING - The Spectre of Outside Days

PollyM

Active member
Messages
195
Likes
7
POST #1

Backtesting gets such a bad press, but care needs to be taken not to throw the baby out with the bathwater.

In principle, backtesting is a very useful tool. Most methods of calculation are, however, very questionable. At best, some backtesting methods will give you a very loose idea of potential outcomes, at worst they can be downright dangerous to a trader's financial health.

The purpose of this series of posts is to show reasons why backtesting can fail to deliver on its promise, including a discussion of one of its most insidious inhabitants ... Outside Days. This aspect is often overlooked, simply because it is adept at blending into the hills and valleys of the land named Price. Most abominable, yet I know it often rears its head without much notice being taken of it.

Once we take into consideration the above, together with typical trading costs, we can then make good inroads into developing a relatively simple backtest method using a spreadsheet, no bells and whistles needed to start, but very happy for you to then develop and modify to suit your own trading style.

Each of the following posts will be fairly short and sweet, and I'll do my best to keep up a decent rhythm. Thanks for looking in.
 
POST #2

To start, we need to decide on a single 'process' that can he applied across the board. In doing so we can then create a benchmark reference, a sound starting point from which to build up trading experience.

I've chosen a simplified version of Wilder's Directional Movement System, principally because this indicator pays constant mind to the full range of price movement, all highs and lows. This is important, as most indicators when backtesting usually only refer to the end of day/period close price, which immediately lends itself to distorted calculations of outcomes.

This simplified price indicator can be known as INDE, standing for Increment Decrement. It is different from Wilder's DMS in two ways:

1. It keeps to the first level of calculation of the Directional Indicators, +DI & -DI; it does not proceed to calculate the ADX as a secondary filter.

2. For each period, it includes both higher highs and lower lows in price range relative to the previous period; in contrast to Wilder's DMS which only includes the greater of the two.

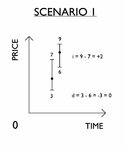
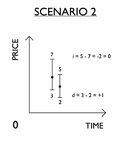
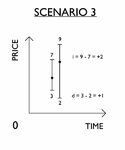
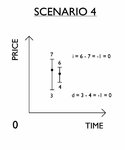
The attached illustrations show the four kinds of scenarios possible for the accumulated calculation, as one period moves to the next. Where the present bar does not extend past the previous bar, then a 'zero' is recorded for the corresponding increment (i) or decrement (d), or for both in the case of an Inside Day (Scenario 4). In the case of an Outside Day (Scenario 3), both the increment and decrement amounts are used in calculation. I'll come back to Outside Days soon to explain why they can create fatal distortions in the backtest calculations.

image003.jpg

image004.jpg

image005.jpg

image006.jpg
 
POST #3

I've posted before on how the INDE formula works, creating two streams of accumulated increments and decrements, indicating long or short depending on which stream is above the other. I've also highlighted that it is important to pinpoint the actual crossing points, and use these in the backtest calculation (REALtime), as opposed to including an amount of price movement which preceded the actual crossover signal (FALSEtime). These factors are all critical in arriving at useful backtest results.

It is also important to subtract trading costs, which to start with comprises a straightforward percentage deduction for each trade, as in the case of spreadbetting. Any finance interest on daily 'rollovers' is also a consideration.

The last but not least factor to be taken into account is intraday volatility. Given the nature of the price indicators and stop assessments, including INDE, there is always the possibility of being stopped-and-reversed twice-over in the same period, as price swings about in a relatively volatile way within a short time. For example, you may start the day in a long position, then stopped-and-reversed into a short position, only then be SAR'd again back into a long position ... OUCH!

With INDE this can only happen on Outside Days because of the nature of its calculation, and also only in cases when the price bar breaches the 'opposing' SAR signal line, as calculated from the +DI or -DI depending on your active position. And this will happen with greater frequency the smaller the accumulation factor you apply (or the shorter the moving average if using other price indicators).

With most backtesting calculations, this 'double reversal' will not be detected as the position at the end of the period will be the same as the start of the period.

An allowance therefore needs to be made to account for the losses incurred by such double reversals, as without it, a truly loss making prospect could be made to look profitable. We will see this when I present the ratios/comparables shortly, starting with a forex pair and the S&P500.
 
POST #4

I mentioned in the first post that we are looking for the reasons why backtesting seems to fail to deliver its promise. Once these reasons are identified we can then properly account for them in the backtest calculation, increasingly providing better aproximations of outcome. From these outcomes we can then develop ratios and comparables, and it is this stage which really opens the doors to effective trading. It is the point at which you come to 'know', rather than guess.

Effective trading comes from knowing odds, and how to swing them in your favour, knowing which markets and timeframes to focus on, and which to let go of. You may ask why some markets are 'allowed' to be traded if they are simply not tradeable - well, it's a free market which operates on the principle of buyer beware. It's your choice, we have been given free will, so choose carefully.

Once we arrive at a format for presenting these ratios and comparables, which I'll do in these posts, this process can be repeated for any market and any timeframe. The best analogy I can make here is with the quick reference nutritional information that you find on food boxes and wrappers, seeing at a glance the main characteristics of any particular product.

As historical price data will not change, some core benchmarks may be laid down, for example, the S&P500 from 1960 to 2010. Dynamic benchmarks can also be developed, showing how any particular markets and/or timeframes perform across different time windows. There are many variations.

Perhaps a most helpful use is that price data from various spreadbetting providers and trading platforms can be analysed and 'league' tables built up clearly showing which providers most faithfully reflect the main market profile.

Remember, however, some markets are more tradeable than others, even if you are dealing only with the main market. Again, the INDE benchmark process will help you sort out the wheat from the chaff in this respect also.

I must point out at this stage that I'm not saying that INDE is the indicator you should trade by. In fact you will see that many of the analyses bring about negative outcomes. What I'm saying is that it can be used as a universal benchmark, a point from which you can develop ways of ratcheting up your returns from an origin point, an absolute reference. From past analyses I've done, INDE sits in the middle of the many other price indicators.

Once you get used to general make-up of INDE, your next major milestone will be to surpass it, to wave it goodbye. The methods by which you can do this vary, but may include amending the code to:

1. Analyse the performance of other price indicators.
2. Simplify the code even further, possibly moving away from the usual fayre of indicators, averages and accumulations.
3. Investigate the effects of applying a dual time calculation, where the broader period works to filter out the signals, which means moving away from the pure SAR positions of long or short only, to presenting the three possible positions of long, short or out.

The following posts will start to look at the ratios and comparables, and contain a relatively simple spreadsheet which you can download so to replicate the process.
 
POST #5

In the next post I'll attach the spreadsheet with instructions on how to insert the price data and output the numbers and ratios. Ideally I would prefer to include the price data but for copyright reasons this is not possible. So it will take a little bit of work on your part, but not much, to replicate the outcomes that I'll make commentary on. The price data will be drawn from the historical data service on Yahoo Finance.

To start with we'll look at the S&P500 over a long time period, and present the following numbers and ratios over a range of accumulation factors on a pure stop-and-reverse basis, using INDE as the base calculation or benchmark.

1. CUMULATIVE PROFIT OR LOSS. The black and white net outcome of a profitable or loss making prospect; a positive number or a negative number.
2. PROFIT TO LOSS RATIO. To then colour the above, the amount of gross profit made compared to the amount of gross loss made, which returns the net figure in 1 above.
3. AVERAGE RETURN TO SPREAD RATIO. The average amount of net profit (or loss) made relative to the spread.
4. PROFIT TO LOSS NUMBER OF TRADES RATIO. The number of profit trades made compared to the number of loss trades made. This is also intimately linked with the average profitable trade and average loss making trade. Very much an eye opener.
5. AVERAGE NUMBER OF PERIODS PASSING BETWEEN TRADES. Naturally this will be proportional to the 'length' of the accumulation factor but still good to know.
6. INCIDENCE OF 'PERTINENT' OUTSIDE DAYS (PODs). This measures, as a percentage of the overall number of days/periods, the amount of Pertinent Outside Days that have been detected; remembering that this natural intraday volatility would normally pass under the radar of most backtesting calculations. The word 'Pertinent' is used as it is only those Outside Days which breach the stop-and-reverse signal lines twice in one day (or respective period depending on timeframe) which are relevant to the backtest calculation and for which deductions are made. For many, this will be a crucial output, which will expose by way of cold calculation the reason why most backtest systems do not deliver on their initial promise. You will begin to see which market personalities are essentially pulling the wool over your eyes, to put it politely.

That's six principal outputs to start with, which I may add to as we move along.
 
Last edited:
Market chart: Price and time - Trend and consolidation (volatility range(s)).

Continuity breakers: gaps (non-trading periods)

In a perfectly realistic world, all markets would trade 24/7. Maybe something for the future?

Interesting thread, Polly.
 
Thanks kimo'sabby.

I'm presenting this so that new traders do not have to keep re-inventing the wheel. It gives a rudimentary process, and I'm very happy for new traders to take this forward for their own use, modifying it to suit their own personality, without any of the limitations imposed by pre-packaged software and the usual copyrights.

It's taken me a long time to get to this point, and there is still a long road ahead, but one I'm sure to look forward to. I'm not giving the 'answer' as such, as there are many answers. It's just that some answers are more fruitful than others.

The human experience of trading, both physically and mentally, opens the doors to many areas of thought that you would not otherwise access. I would encourage any new trader to keep going, making sure to start small, to walk before running, and to take what is presented here as a benchmark process, a minimum standard to seek to attain in the first instance, and then wave goodbye to once you have found your footing.

Once these posts are complete, I'll add to them now and again with any updates, which will also be posted on the indetrader website.
 
Last edited:
The reason backtesting fails to deliver is simple - conditions change all the time.

Ten thousand EAs have been designed on backtesting and they still have to bring out new ones every few months because they don't work.

To assume the market will behave tomorrow like it did yesterday is clearly wrong. If there were black and white rules to make a profit, don't you think they would have been discovered after literally millions of man-hours searching?

Every moment is different from that which has gone before and that which is to come.

Trading is not an easy option. I think if you properly read my posts rather than taking the usual cynical view you may get somewhere.

Or do you mean that trading cannot deliver a profit no matter what you do, and that brokers and spreadbetting providers are ripping everyone off because they know this already?

To not know is to gamble. Are you a gambler?
 
POST #6

I've attached the spreadsheet which, once you populate with the data referred to below, will output the figures shown on the attached pdf (I've had to zip the spreadsheet to enable upload as it's around 5 megabytes in xls format). The most critical figures are shown in the table above the first graph, and draw from those outputs boxed in red. The graphs are provided for quick glance and not primary reference, hence lack of labelling and general draft form.

To insert the data, go to Yahoo Finance and download the daily prices for the S&P500 from 1 January 2000 to 31 December 2010. Sort the data into ascending date order, and copy and paste the high, low and close prices into columns C, D & E, rows 4 to 2770.

Once done, the bottommost section of outputs should be identical to the pdf print. The accumulation factor in cell AT2778 can be adjusted to arrive at its respective outputs. Let me know if you find it different or some steps seem to be missing, and I'll help fill in the gaps.

The spreadsheet is still in its formative stages so apologise if it seems a little cluttered at the moment. I'll run through the most important outputs below so you can go straight to the information.

First off, the S&P500 is 'tradeable' on the face of it, as it's generating positive outcomes across most of the accumulation factors, generally peaking around the 8-13 mark, wavering around 1,000. This amount is adjusted for Pertinent Outside Days (PODs) which, at an accumulation factor of 8, reduces the unadjusted amount by 499.4, from 1,627.66 down to 1,128.26.

I should mention at this stage that the numbers quoted above are based on an equivalent of trading £1 per point. In other words, if you traded the S&P500 at £1 per point since 1 January 2000, at an accumulation factor of 8 and spread of 0.4, then the outcome by 31 December 2010 will be approximately £1,128.26.

Keeping on the theme of an accumulation factor of 8, we can see the following:

1. CUMULATIVE PROFIT OR LOSS. As noted in the above paragraph, we are looking at a positive outcome using a middle-of-the-road price indicator (INDE). Not a bad start.

2. PROFIT TO LOSS RATIO. This is 1.37:1, the cumulative profit being made up of the difference between a 3944.6 profit and a 2872.2 loss. Things are looking a little less rosy. Remember, I'm showing some of the challenges of trading so, once these are known, you can make more informed decisions. It's interesting to note that this ratio holds a pretty steady state over a broad range of accumulation factors.

3. AVERAGE RETURN TO SPREAD RATIO. The average amount of net profit made relative to the spread is 8.25:1. Not bad going.

4. PROFIT TO LOSS NUMBER OF TRADES RATIO. This is a most interesting one. At a ratio of 0.49:1, there are 113 profit making trades compared to 229 loss making trades! So for every profit making trade there are at least two loss making ones. This seems a bit odd given we have a overall profit outcome, but it is because the average profit making trade is 34.91 compared to 12.54 for the average loss making trade.

5. AVERAGE NUMBER OF PERIODS PASSING BETWEEN TRADES. This is 8.1 days, which remember is an average and will actually see some intensive clustering and contrasting quiet periods. As expected across the accumulation factors, this output produces a smooth rising curve which is proportional to the 'length' of the accumulation factor. I've also plotted the number of trades (row 7 on table), which is naturally inversely proportional across the accumulation factors.

6. INCIDENCE OF 'PERTINENT' OUTSIDE DAYS (PODs). This is 0.51% across the whole time range (14 incidents over 2767 days), and comprises 8.2% of all trades made. This factor will be better understood when different markets (and timeframes) are compared relative to each other, as I'll do in the next post with a forex market.

Interesting times.
 

Attachments

  • 003 INDEcore#-SP500 2000-2010 [without price data].zip
    965.7 KB · Views: 201
  • 003 INDEcore#-SP500 2000-2010.pdf
    43.1 KB · Views: 407
Et dimitte nobis debita nostra sicut et nos dimittimus debitoribus nostris.
 
There comes a time to move on, and that line was crossed many years ago.

My dear forex, you are living on borrowed time and I have come to take you home.

Your maturity is now misusing your greater mind and abusing adolescent traders.

I have no need to comment on the figures as they speak for themselves.

Polymath, signing off.
 

Attachments

  • 003 INDEcore#-GBPUSD Dailyx10000 2000-2010.pdf
    44 KB · Views: 370
Top