Best Thread learning to read price action with p/f charts

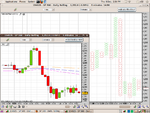
then if we look at the same chart...1 box reversal
we get a nice trading signal to go short
the 1 box horizontal count target was hit

14me0xh.gif
 
eurusd
10 minute dat29 pips by 1 reversal
support areas are shown in green,horizontal lines
resistance ..red horizontal lines
approx 3 weeks of data
you can make a healthy income trading from those pivots


ngzpj6.gif
 
Hi Dentist,
Great thread & thanks for the tip on the du plessis book.
I use etxcapital (it-finance charts), but I think they are incorrect.
Wondered if anyone else had noticed? and/or agree with me?
If you look at the screenshot below, the high of the 14:25 candlestick bar is 1256.6
The P&F is 0.5x3 (5m H-L range), but the highest X column is 1255.5 - 2 Xs missing?
Actually I think there are quite a few columns missing.
What do you think?

Has anyone found problems with ETX and/or IT-Finance charts?

(or have I made a mistake in how I think P&F charts are constructed??)

Cheers
Padnoter
 

Attachments

  • sp500_pnf_prob.png
    sp500_pnf_prob.png
    81.4 KB · Views: 272
dont bother with it-finance p/f charts
if u want to get serious then get bullseye $99 one off payment.data is free
 
S &P 500 index
30 minute data
4.00 points by 1 reversal..close
care with shorts
a bullish chart.good support at those double trendlines

11uhuzl.gif
 
dont bother with it-finance p/f charts
if u want to get serious then get bullseye $99 one off payment.data is free

thanks for the reply.
looks good, but i'm not on windows (ubuntu), and couldn't see an easy realtime data feed option (tho' i can see V5beta does?).

When you said "data is free" - did you mean EOD yahoo type?
 
thanks for the reply.
looks good, but i'm not on windows (ubuntu), and couldn't see an easy realtime data feed option (tho' i can see V5beta does?).

When you said "data is free" - did you mean EOD yahoo type?

data is free either from yahoo or freestockcharts.com,or dukascopy
also you can export data from quotetracker
 
an update on the chart that was posted last weekend
price broke down from the double trendline support.down to to the next trendline supp area.then a minor rally ,possibly for option expiration last friday

122clr6.gif
 
same data input
3.50 by 2 shows price action more clearly
note res area at 1240
santa rally has to break this first

o03yna.gif
 
s 500 index
30 min data
2.50 points by 3 reversal....close
the latest break from 1240 has not retraced/the latest upthrust is unsupported as yet and is in a res zone
so 1255 is the 50% zone if the bulls fail

24cz1ts.gif
 
s500 index
30 min resistance
an upside break or a failure at resistance
nfp failed to take it higher
so lets see


24zhbes.gif
 
eurusd
4 hourly data
28 pips by 1 reversal...close
we can see the nice downtrend since beginning of november
has it made a bottom ????
the latest pole/low...the 50% area is approx 2800 area.
otherwise down we go on break of 2700 area

21ke554.gif
 
now...we want to see if eurusd is possibly starting a rally
10 min data
10 pips by 1 reversal

note..there was a trap before nfp.market rallied higher before nfp.then broke after nfp..green line
th last signal was bullish/blue line.a recoilresistance starts at the lowest internal trend line approx 1.2750
so price has to stay above 1.2750 area to mintain some sort of bullish action
imho

se9lj9.gif
 
500 index
the first sign of trouble will be a test and a break of the blue trendline
30 min data...3 point box size by 1 reversal

295pyj5.gif
 
s500 index
hourly data..10 points by 1 reversal#euro downgrades have not had too much effect on the index
there is a major supp area 1270-1280.the top two trendlines being close together.if that breaks then 1250 trendline area


1zg8h87.gif
 
nasdaq100 index
hourly data 12 points by 3 reversal
the latest breakout has not pulled back
could be vulnerable

25u30r5.gif
 
a closer look at the latest break on the nas 100
same box size
1 reversal now
we can see trendline supports and the previous breakout point

35l7045.gif
 
Top