Best Thread learning to read price action with p/f charts

care needed with the stock rally that is being talked about
dollar index 0.35 by 3 hilo.daily data input
there is a test of a major trendline,but no signal ie.double-bottom that is needed to show a proper break of trend.one more "O " is needed

30vho4z.png
 
eurusd.
21 pips by 3 ..hourly hilo
either we break out or we get a failed signal,support is near now.if that goes,stocks break down to next supp level
eurusd.
21 pips by 3 ..hourly hilo
either we break out or we get a failed signal,support is near now.if that goes,stocks break down to next supp level
eurusd.
21 pips by 3 ..hourly hilo
either we break out or we get a failed signal,support is near now.if that goes,stocks break down to next supp level
2i9tfmg.gif
 
ftse 100
hourly close data.this takes out some of the noise
broken a minor downtrend.pulled back to support and bounced.lets see if it holds
15 points by 3 close ..hourly

a9tf2r.gif
 
if anybody is thinking that markets will crash....then think hard..look at this chart of the nas 100
10 points box size by 3 reversal
close data...daily plot

r249ac.gif
 
an intermediate downtrend in a massive uptrend..loads of support at the confluence of green trend lines.this is the price action and not change in price over time/candlesticks
 
nas100.hourly
6 points by 3
close data input
#showing ame characteristics as the fstte 100
ie a minor downtrend broken.a new uptrend that has pulled back to support
lets see if this support holds

20trrzb.gif
 
cable.gbpusd
looking overextended to the downside.a long down thrust column with no recoil
10 minute data input.23 pips by 3 reversal..close data plotted

approx 3 weeks data
numbers are dates of the month

15fooow.gif
 
a closer look at the down move.
this weeks price action.s/r showed up nicely,making life very easy
14 by 1 ..close/10 min

2yws2ly.gif
 
nas 100
10 min data input
6 points by 1 reversal
close data plot
next suppport area at 2270,and 2240 area
downtrend lines in position to find out any strengths or weakness in this latest down move

34zx4hz.gif
 
Understanding and using point and figure charts - £99*
Friday, 11 November | 1.15 pm – 5.15 pm

Jeremy du Plessis Jeremy du Plessis, author of The Definitive Guide to Point and Figure, will be hosting a rare "Point and Figure" workshop for retail traders and investors at this year's World MoneyShow in London. The four-hour intensive workshop is designed to give you a full understanding of point and figure charts, starting from the history of this charting technique, covering the theoretical and practical aspects of point and figure charts, leading to more advanced professional and modern approaches of using point and figure charts.

This interactive workshop will cover:

How and why point and figure charts were developed.
Point and figure construction methods and when each method should be used.
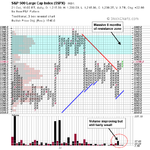
Trend lines as a vital part of point and figure analysis.
Establishing accurate price targets with point and figure charts.
Calculating risk/reward ratios and how they can help assess your position.
Using point and figure to measure market breadth and to determine market turning points.
Ground breaking new point and figure charting techniques.
Live point and figure charting session, including live interactive analysis with the audience.
This workshop is a must for any serious home-based trader or investor.


world moneyshow in london
 
Ground breaking new point and figure charting techniques.
Hi dentist007,
As you know, like you I'm a P&F fan but, for £100, I wonder what one gets from the workshop that one can't get from his book at half the price. The bit quoted is the only obvious thing which, I must say, raises a level of scepticism in me. That said, JdP is the bees knees when it comes to P&F - so I'll keep an open mind. If you're going, perhaps you'd be good enough to update this thread with what these ground breaking new techniques are please?
Cheers,
TIm.
 
hi Tim
not going myeself
the new stuff he is going on about is in his chapter in the book "breakthroughs in technical anlysis"
i think
He has put on oscilltors on o updata that are calculated from the centre of the column.so, basically,you can look for divergence etc etc
i have my own way to do this as i dont use updata.i use my daughter"s plastic rulere and measure the distance between the moving averages on the bullseye chart.i measure the distance in mm and see if it diverges.the ruler cost 25p.well worth the money !!
 
here is a snippet i got jeremy to write for us

Point and Figure was originally and still is a charting method to plot trades as they happen. This means that Point and Figure charts were drawn using tick data. When tick data became more difficult to obtain, users of Point and Figure decided to use end-of-day daily data. In order to account for the days range, the high/low method was devised. But there are problems. With daily data you do not know whether the high or low came first, so either the high or the low are used, but never both. This causes quite a few anomolies which is why the close is a better field to use. Furthermore, instead of using daily high/low, it is better to draw a 60 minute, or 5 minute or even a 1 minute chart based on the close at the end of every time frame. At least then the path the price has taken during the day is tracked which is not the case with daily high/low charts.
 
ok..so the anomoly
say price is moving in a downtrend and it say,spikes upwards at the open,enough to pint a 3 box reversal.then the chart will print a 3 box reversal as it was the first move.the stock/fx pair might have got sold off after the spike,but the hilo plot will show a potential reversal as it only plots the first move.this is what i think he means
 
dow
eod /close data
80 points box size by 3 reversal
another fake...this latest breakout ha not been supported as yet.need to p/b and retest the bulls at some point soon

3148ew8.gif
 
Hi dentist007. It did manage a pullback on the S&P 500 P&F Chart (10 point box size), however volume is still fairly low overall, so IMO it would need to see a lot more volume if it breaks out to have any chance of getting past the 8 months of resistance above any time soon.
 

Attachments

  • SPX_21-10-11.png
    SPX_21-10-11.png
    18.6 KB · Views: 352
s500 hourly data
showing the latest breakout
we should get a test of the 50% zone/1265 area

fmuhpz.gif
 
cable
gbpusd
hourly data
20 pip box size by 3 reversal
start of a new uptrend.a shakeout on friday.at support
new trend could fail.does not look like it at this point


167kzud.gif
 
cable..gbpusd
10 min data..12 pips by 3 reversal
price action on thusday and friday coiled up and we got a triangle that popped after non farm payrolls

ifq61w.gif
 
Top