June '04 Forex

Newtron Bomb

Guest Author
Messages
1,602
Likes
87
Hiya Folks

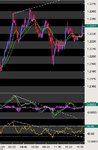
Thought i'd put this up for discussion. There are a few things to note on this chart and it would be nice to see how they play out.

I'm currently long while the price consolidates with a reversal short ready for a potential BO south.

Comments?

NB
 

Attachments

  • Image1.gif
    Image1.gif
    24 KB · Views: 456
Last edited:
Hi NB

I don't look at Cable much, but interestingly, the last high on your chart of 1.8397 was the R2 level, which indicates a short (with a tight stop). :cheesy:

Edit: Hammer on 5 and 15 min charts confirm reversal at this level.
 
Last edited:
I'm currently long on Cable but would agree that the chart suggests a move South.
 
Just when you think its safe to enter the water...

The above chart did look like a reversal and an asym tri, however as new information unfolds the pattern changes. There was a nice early warning of a messy day from about 9am which i have been playing with but its all on the chart for you to look at.

No swift follow through on the BO to target with a reaction off the 50% fib of the days high/low range with a nice hammer too...

Is this just support becoming resistance? or are we looking at a channel

Regards
NB
 

Attachments

  • 01-06-04 gbp 15 min.gif
    01-06-04 gbp 15 min.gif
    13.1 KB · Views: 469
Well I thought June may be busting out all over. I'm sure my bank will be busting with laughter after taking a long on cable at 18403, long Euro at 12257 and a short on swissy at 12454. If only I had put all the positions in reverse. Tomorrow is another day................
 
Welshmal - if its any help - I went short on the MACD & RSI ND at 1.2251, was feeling quite pleased with myself as it dropped - even more pleased as it started consolidating for another drop (or so I thought). Closed at 2240 as it rose unexpectedly.

To rub it in, it dropped big time a few min after I closed.

Then my big mistake came after it started up after the spike down - chance to get in with a short on the pullback I thought - finished the day 20 points down in the end. Analysing back, my mistake was being impatient, bored and over eager to make up for my first trade that I closed to early - I broke my rules.

To save your bank balance, I would suggest commiting money on the safest entries - use a demo account for other riskier trades.
 

Attachments

  • Image1.jpg
    Image1.jpg
    50 KB · Views: 602
I try and post as frequently as possible to demonstrate the reality of trading. Some days are good, others not so. However, I feel that we are a community with a variety of experience and knowledge. Hopefully it is of benefit to all to read and share experiences. The learning curve is steep and on-going but I note this thread is read by a large number of people. I would encourage you to share your thoughts and experience.
 
On Jonny T's system I have cable at 18463/18445 with a break out now to sell already hit. However holding back as the chart suggests a rise rather than a fall. The Euro/dollar looks as if it may well produce the same but here again I feel we are due to go further north.
 
Morning all.

Long Swissy at 1.2420 with 20 pip SL.

Here's to successful trading today. :cheesy:
 
Hi NB

Yup! A good trade from R2 to 50% Fib - confirmed by hammers at both ends.

Newtron Bomb said:
The above chart did look like a reversal and an asym tri, however as new information unfolds the pattern changes. There was a nice early warning of a messy day from about 9am which i have been playing with but its all on the chart for you to look at.

No swift follow through on the BO to target with a reaction off the 50% fib of the days high/low range with a nice hammer too...

Is this just support becoming resistance? or are we looking at a channel

Regards
NB
 
Sanity check...

...looking at the hrly EUR/USD chart, I see a triangle BO long, with a mouth of 140 pips, to give a target of 1.2434. Does this look right to you?
 

Attachments

  • EURUSD_hrly triangle BO.doc
    79 KB · Views: 383
Hi ppl,

Well I'm short Euro from 1.2268 using the 7-10 BO system.

CC : You're ascending triangle pattern looks good - however, could the chart also be showing a double top at 7:00 on the 28th and 7:00 and 8:00 today ? I dunno !

I had a losing day yesterday (35pips) so I hope for a win today.

Good luck everyone. :cool:

Regards,
 
Could be Ivorm, time will tell. I'm long EUR/USD on the 1am - 8am lol. No trade yesterday using this one. 1am-8am generated 200 pips for me in May. Many thanks again to JT and subsequent contributors for that.
 
Chow

I have to agree with Ivor. There's a DT with MACD divergence - see attached.

ChowClown said:
...looking at the hrly EUR/USD chart, I see a triangle BO long, with a mouth of 140 pips, to give a target of 1.2434. Does this look right to you?
 

Attachments

  • eur.jpg
    eur.jpg
    84.8 KB · Views: 338
Swissy at 1.2446 (+26 pips). SL to breakeven. A slow day .... :(

Goober said:
Morning all.

Long Swissy at 1.2420 with 20 pip SL.

Here's to successful trading today. :cheesy:
 
Figures

Goober said:
Swissy at 1.2446 (+26 pips). SL to breakeven. A slow day .... :(


Maybe there are figures due out this afternoon?
 
2290 resistance on euro - hourly chart+ half hourly and fifteen minute
and 2260 for support level, thus we are trading in a narrow channel?
 
Stopped out at 1.2420 (breakeven). Its been a sloooow day ....!

Goober said:
Swissy at 1.2446 (+26 pips). SL to breakeven. A slow day .... :(
 

Attachments

  • love is blind.jpg
    love is blind.jpg
    19 KB · Views: 268
Top