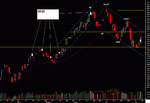
Posted on the Yahoo SMI-Wyckoff board, I thought some on this board might find it interesting. Everybody has their own terminology, most of this is obvious: BC is Buying Climax, AR is the Automatic Reaction which follows. The BC and AR form the boundaries of the Trading-Range, TR. The ST is the Secondary Test of the BC, which confirms that it is indeed the end of the uptrend for now, at least. In this case it is also an UT, Upthrust of the previous high. The SOW is a Sign of Weakness (following the establishment of the TR) which breaks the TR decisively on strong vol and wide spreads closing on the lows, as we have here, showing that supply has overtaken demand. The LPSY is the Last Point of Supply, the backup to the TR that so often occurs. We also pay particular attention to the depth of the retracements as normal (50%), shallow, or deep, similar to Fibs. So here's my Wyckoff analysis for those interested:
http://www.streamload.com/hcour/Oil_5-09-05.gif
http://www.streamload.com/hcour/WK_Oil_5-06-05.gif
June Oil appears to continue to struggle w/supply.
On the daily chart, coming off the BC/AR/ST-UT, the reaction 4/04-4/18 is sharp on strong vol, a possible SOW that breaks the trading-range support, retracing 62% of the whole 2/08-4/04 rally.
4/18-4/22 rally retraces 62% of that previous reaction on the backup on relatively narrower spreads and lower, contracting vol, a possible LPSY. Then 4/27 supply on the widest spread on the chart, closing on the low on good relative vol, breaking the trading-range support again most decisively and the last 3 bars wipe out most of the previous rally. The next day a good spread closing on the high on strong vol, a possible spring of the 4/18 low, but it does not follow-thru as the next day reverses it, but on low vol and then price finds support at the Jan highs. Here price basically goes sideways as there is no immediate demand off the support.
5/04 vol comes in on a good spread but the close is well off the high, then 5/05 vol is low and price can't make a new high. 5/06 rallies to exactly the 50% retracement on a good spread and strong vol, but closes below mid-range on nada price gain; lots of effort w/little result on this bar. Yesterday closes well and appears to show some demand, but price is struggling mightily to get back to the channel supply line and the AR/trading-range low, also at the 4/27 EOM bar.
On the wkly chart, the wk of 4/29 is the widest spread in 5 months, closing on the low. Last wk 5/06 a narrow spread, closing well-off the high and little price gain on equal vol.
SMI-Wyckoff board:
http://finance.groups.yahoo.com/group/Wyckoff-SMI/
Harold
Last edited:

