You are using an out of date browser. It may not display this or other websites correctly.
You should upgrade or use an alternative browser.
You should upgrade or use an alternative browser.
Jamal D - Trading Price (the journey of an over-thinker)
Jamal D
Junior member
- Messages
- 12
- Likes
- 5
Why?This is ironic.
You say you're an over-thinker and you start a thread. Then you enter "Never mind". Second thoughts?
Also you talk about only having 50% commitment as being a negative - and again, you've started and then pulled out.
I used to be indecisive too, but now I'm not so sure..........
🙂
Also you talk about only having 50% commitment as being a negative - and again, you've started and then pulled out.
I used to be indecisive too, but now I'm not so sure..........
🙂
Jamal D
Junior member
- Messages
- 12
- Likes
- 5
No I just think that the level of details I see on other peoples charts is a requirement for me also. I will post something a little bit more detailed the next time so it is easier to judge my analysis...and not do the analysis for me.
I sold all I had to do this full-time and I have survived and also made some money...so I think my quote indeed reflect my commitment 😉
I sold all I had to do this full-time and I have survived and also made some money...so I think my quote indeed reflect my commitment 😉
Jamal D
Junior member
- Messages
- 12
- Likes
- 5
Ok, so I went back to the drawing board....I actually thought I had taken a big enough step back in my trading journey but realized there was still a row behind me in the class room with available seats.
I have taken DBPhoenix suggestion of focusing on one stock for now. I have not traded since I made the decision, but just by focusing on one stock I feel both 1. Mental relief. 2. Attention to details has skyrocketed. 3. My days are not chaotic. 4. My FOMO has almost left the building.
I realized that studying and trading was a toxic combo for me. The stress-levels affected my decision making so badly, simply trashing my win rate, and even worse for my confidence to execute.
I have the following assignment for March:
1. Observe.
2. Tendency-testing with data back to the beginning of 2015.
3. Continue to study the material of DBPhoenix.
4. Start testing simple setups/strategies and see confluence factors with the Tendency-testing.
Like many others Excel is a big part of my trading-universe. Pos Size, System-targets, SL-calculations etc. But I have started to take my Excel coding to the next level. Actually pretty fun stuff to work with and you train your IF-THEN approach. I hope it will give me some insight to how price move in certain periods.
Honestly I have mixed feelings about very complicated back-testing. To put it simple...I don`t believe in it (markets are random). What I do believe is what I would call "tendency-testing" where you test simple tendencies in the market. I am working on an Excel sheet were I can feed data from any stock and get some tendency-answers. If it will help my trading, I have no idea...but at the very least it gives me awareness and a hypothesis I can bring to the market with the SLAB-material from DbP.
My first tendency-testing has been to find the average occurrence of up/down days for each weekday. I have looked at all numbers overall, and from year to year. Some interesting tendencies has come up, and I have already written my first algo that I will program later.
Next I want to see the average %gain on +days, and the average - day. Also with filters of average %gains if price moves +1/-1, +2/-2 etc.
Any other members perform any raw-data tendencies before they start working on setups/strategies? Any points of interest you would like to add?
Last edited:
I have taken DBPhoenix suggestion of focusing on one stock for now. I have not traded since I made the decision, but just by focusing on one stock
What stock have you selected?
I've been coming across this @dbphoenix guy here, there, and everywhere. Looks like he's a real old-timer. I was wondering if anyone was still following his stuff.
I used to be indecisive too, but now I'm not so sure..........
😆
Any other members perform any raw-data tendencies before they start working on setups/strategies? Any points of interest you would like to add?
What, exactly, are you trying to accomplish? What stock are you looking to trade? Over what sort of time frame? Are you a day trader, short term swing trader, longer term position trader?
For example, if you are a day trader, I do not think you are looking at the most relevant price information. If, on the other hand, you are looking to play 2 to 3 day swings, then perhaps you're on the right track.
Jamal D
Junior member
- Messages
- 12
- Likes
- 5
What, exactly, are you trying to accomplish? What stock are you looking to trade? Over what sort of time frame? Are you a day trader, short term swing trader, longer term position trader?
For example, if you are a day trader, I do not think you are looking at the most relevant price information. If, on the other hand, you are looking to play 2 to 3 day swings, then perhaps you're on the right track.
I am currently focusing on one stock only in the energy sector. I am looking at swings over 1-3 days.
Timeframe is 1hr/Daily for now. I disagree that it is not relevant for a daytrader, but who knows? If the average up-Monday with an occurrence of more than 60% is +1%, perhaps that is not the day you want to look for daytrades. Anyway, this is not my focus for now.
I also want to check average % moves on + days and -days above if above 0,1,2 %. Next I want to look at two day tendencies with certain criteria. Like, IF Mondays were down x%, how would the next day be. Very basic, and I am not really looking into sophisticated models. After all I want to trade price.
I am trying to accomplish the following:
1. Improve my Excel abilities.
2. Improve my IF-THEN thinking and decision making.
3. Get to know the focus-stock intimately (will also do this with the energy Sector/Oil)
4. Possibly see raw-data tendencies that could help me identify a statistical edge on certain days. Even knowing that Mondays are normally bad days for longs if one criteria is met would at a minimum make me want to keep an eye on this in my trading journal over time. (perhaps not trading this stock on Mondays could improve my P/L)
5. Possibly improve my management plan (close positions on certain behavior)
I am doing this together with studying the SLA/AMT material from DbPhoenix. My main focus is still to absorb the written material.
Some might say it is a waste of time when you trade naked charts, but I am interested to see these numbers relative to a backtest/forward test.
Actually I find it hard to define setups based on naked price charts, but I am closing in on something. The reason I want to trade naked is because I want clarity, and I want to pull the trigger as early as possible, and know if I am right or wrong as soon as possible (something linked to my personality and risk tolerance). I want to avoid cluttering the charts with information overload (again) through defining too rigid setups that will put me back into the paralyzing Moving Average-Mode.
Do you trade naked charts also?
Jamal D
Junior member
- Messages
- 12
- Likes
- 5
What stock have you selected?
I've been coming across this @dbphoenix guy here, there, and everywhere. Looks like he's a real old-timer. I was wondering if anyone was still following his stuff.
😆
He represent Wyckoff principles in a pretty straight forward way. Old timer or not, if his material gives me one good idea, it is worth a shot. It is not a rigid full trading system, as he says, "it is a primer" and I will treat it as such.
I disagree that it is not relevant for a daytrader, but who knows?
There is a good chance we are talking at one another and not with one another. My apologies for having perhaps assumed too much.
Do you trade naked charts also?
No chart is truly naked save perhaps the tick chart. But I do use minimalist charts, i.e. no indicators other than price data.
He represent Wyckoff principles in a pretty straight forward way. Old timer or not,
I'm pleased to see how readily you defend him, and I was not intending to appear such as to slight his work. I have become somewhat familiar with what he teaches, and I assure you that I am as much a student of the method as you, if not more so. Perhaps we can study together?
Jamal D
Junior member
- Messages
- 12
- Likes
- 5
There is a good chance we are talking at one another and not with one another. My apologies for having perhaps assumed too much.
No chart is truly naked save perhaps the tick chart. But I do use minimalist charts, i.e. no indicators other than price data.
I'm pleased to see how readily you defend him, and I was not intending to appear such as to slight his work. I have become somewhat familiar with what he teaches, and I assure you that I am as much a student of the method as you, if not more so. Perhaps we can study together?
I answered you in good faith with quite a long post and I am not gonna go further into any kind of verbal gymnastics. A good place to start is to go introduce yourself in the forum, because I have no idea of who you are, but I look forward to see your contributions.
Last edited:
Jamal D
Junior member
- Messages
- 12
- Likes
- 5
So I am in the process now of both forward testing (demo for now) and back-testing. I don`t have the replay option for OBX-stocks, but I still find it hard to spot all these great setups and trade them with conviction live. Still early days, but very useful for developing both setups, management (that I already have a system for) and entry types. Actually, doing real time trade development is probably the most eye-opening and humbling part of it, but it is all good. I would rather know I can not spot setups with fake money in the market, rather than die of thousand paper-cuts. It only end up with poor execution through lack of self esteem, losing mental capital for when it is needed in real life trading. And I have had enough of that.
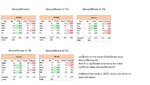
My tendency testing shows this of the first part of the test. It is of course very "raw" but I still find it interesting. Do you see some tendencies? Or you find it totally useless?
Mondays surely seem dull for longs...but I want to see if there are any more tendencies if I connect one more criteria for the previous day of each result.
Any backtest wizards who have some input on how to extract valuable information or does something like this to, but not with complete setups tested?
Attachments
Similar threads
- Replies
- 6
- Views
- 6K
- Replies
- 0
- Views
- 787