The danger signal has been on my Alerts since August 6th and some people have asked for me to explain why since the market has been going up since that time. First of all, my objective in writing these is not to be a short term trading service, it is to provide you with a big picture look of where we are in the overall cycle and what that is likely to imply. That is why I frequently refer to "the sequence of events in the cycle". Let's go over that for a moment. If I was talking about seasons and began advising my readers to prepare for a hot summer, everyone would wonder whether I had lost my mind because we are in November and the proper comments would have to do with winter, not summer. Everyone knows "the sequence of events" in the seasons and what each season implies. That same logic is what I am attempting to get people to understand. As I have stated so many times before, the next phase in the cycle is Liquidation and that is followed by Capitulation, THEN you have the best buying opportunity of a lifetime (but everyone will hate the market and few will have any money).
Now, let's go back and review - you were given warnings to sell on the day of the orthodox top in July 2007 and then also warned of the October 2007 top. Anyone who heeded those warnings sidestepped the worst market decline in 77 years. Then in February 2009 I put out The Sequence of Events in the Cycle which had a chart showing I expected the market to go a bit lower and then have a sharp rally for 6 months or so and that's just what the market did. In early August, I started putting the DANGER sign on my Alerts. Why? Because we were 5 months into the Reprieve Rally (as I had named it in The Sequence of Events in the Cycle) and people don't immediately respond because they are caught up in the excitement.
I said that I had turning points on August 6th or 7th - and the market did turn then. It only fell 40 points and then came back. I wrote another again on August 28th and warned "Don't Drink the Kool-Aid" i.e. don't buy into the bull market concept. In that I said, "My next turn date is mid-September as I mentioned in my prior writing. I had assumed that we would top in late August and have an initial decline and then rally back into mid-September and then fall apart. I don't have any reason to change that outlook." For the record, the market fell from the 28th as predicted and then rallied back into mid-September. In my September 25th I mentioned end of the quarter window dressing and the likelihood of the markets reaching 1100 on the S&P 500 and 10,000 on the DJIA. By mid October, those targets were reached. On October 21, the article titled MARKET TOP! That was my call for the market top. We have now gone marginally higher - so, for the short term, I'm wrong, but my big picture outlook is absolutely unchanged.
I believe the key to market success (and probably to life) is flexibility. I think I will have a hard time expecting summer in November and I will probably have just as hard a time believing this is a new bull market - I just don't buy that. However, when I run into one of these perplexing situations, I take a few deep breaths and look at the charts. In this case, I think a weekly chart of the S&P 500 cash index provides a good "big picture" look at what the market is doing.
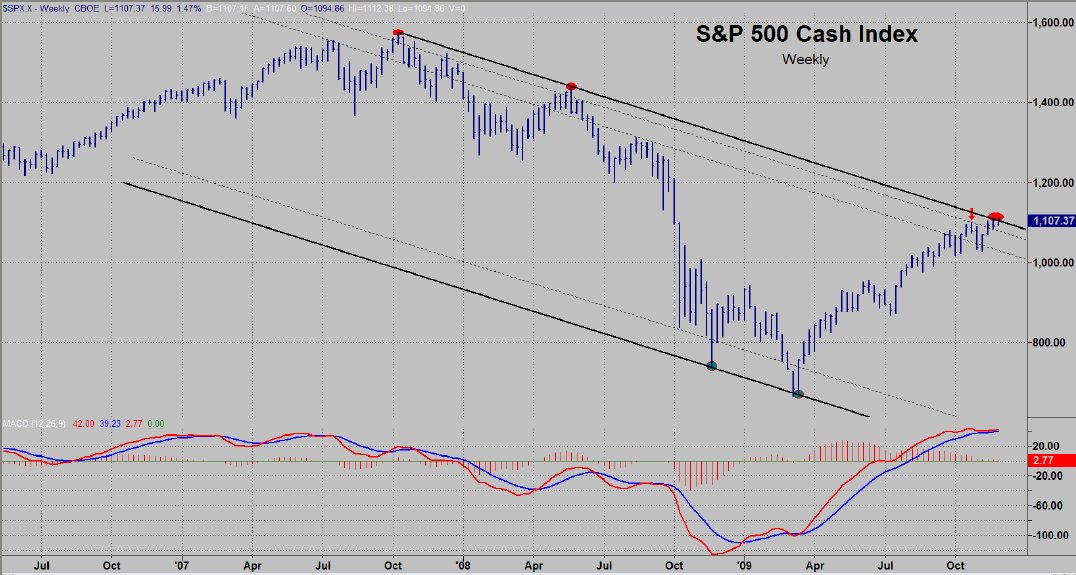
This paints an interesting picture. The market has moved from the bottom of the channel to the top of the channel. It is obvious on this weekly chart where one should have bought and it would appear obvious that this is now a place to sell. I jumped the gun with my MARKET TOP signal about a month ago (see Red arrow). The indicator below is the MACD - note the red line is still above the blue line. Also note that the market has been losing momentum (red histogram bars) since about the time of my first warning in early August.
So, what now? This week is option expiration week and a major holiday, as well. Typically, that is bullish - and we have started off the week with a good rally. So, it is likely that we could rally into the holiday and into option expiration - but there is a problem. If we rally higher and close the week at a level above the upper channel line, we have to consider that the market may be breaking out to the upside. In my work, I look for two closing bars above a major channel line to confirm such a breakout. On the weekly chart, that would require waiting until the end of next week for confirmation.
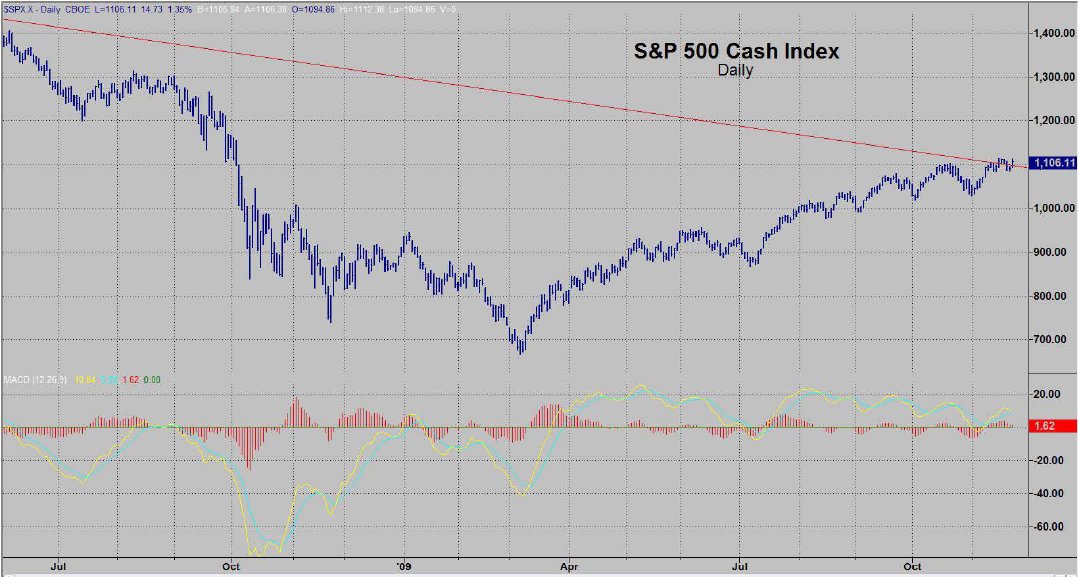
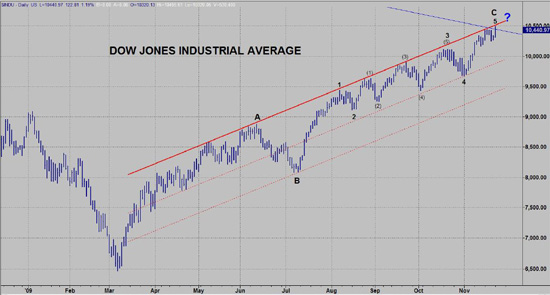
The following two charts are daily charts for the S&P 500 and the Dow Jones Industrials. The S&P 500 daily chart has broken above the trend line from the October 2007 all-time high and has closed above that line for three consecutive days and is now above the line again. So far today, it has not made a new high. The DJIA had made a new high today, but just broke above the line for the first time and may or may not close above it. I have a wonderful Elliott Wave count on the Dow Jones Industrials chart, but it is incorrect - so ignore it. The (4) wave is below the (1) wave and that violates Elliott's rules - so as nice as it may look, it's wrong! Otherwise, the DJIA is running into the red trend line that has turned it away many times before.
This looks to me like we are running into a lot of resistance both in the shorter term trend lines as well as with the longer term upper channel line. However, you must keep in mind that we are in a seasonally positive time for the market and that the market may be attempting to break out to the upside. Therefore, you have to give the market the benefit of the doubt in both directions. In my view, this is a time for extreme caution and a time to utilize all the disciplinary tools at your disposal.
With respect to the economy, it seems like almost all of the stimulus money was used to prop up the banks that were deemed "too big to fai"". That's great, but it leaves all the other banks open to fail. So now you have 8,000 or so regional banks and private institutions that are essentially defenseless against the onslaught of commercial and residential loan defaults. A number of industry analysts and experts feel that as many as 2,000 bank could fail - this being set to happen at a time when the FDIC is almost belly up.
This market has had a habit of making bad news good news. I have seen that happen before, so this isn't a first, however, it is a practice that is short lived because, sooner or later, reality will set in.
I have long suggested that investors define their safe money and be sure that it is truly safe. That used to be easy to do - that is no longer the case. Heretofore, the investor could buy Treasury instruments and money market funds and just hold them in his bank or brokerage account. Now, we have seen what has happened to some previously outstanding banks and brokerage houses. You now have to realize that we are in a much different time in the cycle. When the first barrage of failures occurred, moves were made to shore things up through the stimulus plan and by taxing America. Now, it is a much different story. The funds that were used before are now just about gone - and, my bet is that the American taxpayer may get damn good and mad about shouldering yet another load that was created by others.
Getting back to the problem - investors need to get their "safe money" safe. Now you have a really big problem with that objective.
a) It is very easy to make a sound argument that Treasury instruments and money market funds are nowhere near as safe as they have been in the past.
b) The next problem is finding a safe custodian to park your safe money in. These are two much bigger problems than you might expect. Consider the following:
1) If you think buying Treasury instruments is a good idea, consider that you are buying debt (being a creditor to) from the largest debtor nation on the planet. If you were not a US citizen, would this still be your choice?
2) An alternative would be purchasing money market funds. Some estimates show derivatives to be a quadrillion dollars. It doesn't matter what the real number is (no one knows anyhow) - when some analysts put derivatives at that figure -- and virtually all analysts have it deeply into the hundreds of trillions -- we know one thing: a great deal of that paper has no value. So the real question is "Are you absolutely certain that the money market funds you are in have all of their 'paper' valued at 100% of dollar equivalent value". Obviously, money market funds are not supposed to be discounted - they are always supposed to be 100% of your investment plus interest. So, do you have investment vehicle risk? Do you have currency or 'purchasing power' risk? The honest answer to both is 'yes'. The only real question is "Are you going to do anything about it?" Do you know what to do about it? Are you pleased being highly speculative with your safe money in this economic environment? You will have to answer that one.
3) The US dollar will not remain the reserve currency for the world much longer. There will be a transition period - transitions usually are not much fun. Do you suppose things will get more negative or more positive as we move closer to when the US$ loses its reserve currency status?
4) The US dollar has consistently dropped in value since 1913 when the Federal Reserve was established. From that time it has lost 96% of its purchasing power. That is a pretty long and proven trend.
5) The FDIC is just about broke. Since the Stimulus Plan, 47 more banks have been wiped out in just three months. There are 91 banks that have gone under just this year. The pace of bank seizures is accelerating.
Here's a frightening thought: The government is now becoming your "partner" in banks and other financial institutions, in the auto industry, in the health care industry, etc. If this is "creeping Socialism", it's creeping pretty fast. It might be OK if the government had a wonderful record of success with all of its business ventures, however, the government may be the all-time worst manager of business. It can't even run the post office and our country has been a raging failure in a business sense for a long time. We have extreme
debt. It is OK to take on debt if you are making large profits and need the debt to expand your business and make more profits - and then pay down the debt - but that's not what our government does. We run big losses (deficits) and then take out huge loans to cover the losses. We are, by the way, very consistent in that process. In fact, that's how we do it. It is a prescription for failure.
This week has "Turnaround Tuesday" and I am flying to Southern California later for a few days. The market is pretty good about doing something wild when I am in an airplane or otherwise busy and not being able to be right on top of things. So, who knows, maybe it will be an exciting day. Otherwise, I think we have covered the outlook sufficiently earlier.
Now, let's go back and review - you were given warnings to sell on the day of the orthodox top in July 2007 and then also warned of the October 2007 top. Anyone who heeded those warnings sidestepped the worst market decline in 77 years. Then in February 2009 I put out The Sequence of Events in the Cycle which had a chart showing I expected the market to go a bit lower and then have a sharp rally for 6 months or so and that's just what the market did. In early August, I started putting the DANGER sign on my Alerts. Why? Because we were 5 months into the Reprieve Rally (as I had named it in The Sequence of Events in the Cycle) and people don't immediately respond because they are caught up in the excitement.
I said that I had turning points on August 6th or 7th - and the market did turn then. It only fell 40 points and then came back. I wrote another again on August 28th and warned "Don't Drink the Kool-Aid" i.e. don't buy into the bull market concept. In that I said, "My next turn date is mid-September as I mentioned in my prior writing. I had assumed that we would top in late August and have an initial decline and then rally back into mid-September and then fall apart. I don't have any reason to change that outlook." For the record, the market fell from the 28th as predicted and then rallied back into mid-September. In my September 25th I mentioned end of the quarter window dressing and the likelihood of the markets reaching 1100 on the S&P 500 and 10,000 on the DJIA. By mid October, those targets were reached. On October 21, the article titled MARKET TOP! That was my call for the market top. We have now gone marginally higher - so, for the short term, I'm wrong, but my big picture outlook is absolutely unchanged.
I believe the key to market success (and probably to life) is flexibility. I think I will have a hard time expecting summer in November and I will probably have just as hard a time believing this is a new bull market - I just don't buy that. However, when I run into one of these perplexing situations, I take a few deep breaths and look at the charts. In this case, I think a weekly chart of the S&P 500 cash index provides a good "big picture" look at what the market is doing.
This paints an interesting picture. The market has moved from the bottom of the channel to the top of the channel. It is obvious on this weekly chart where one should have bought and it would appear obvious that this is now a place to sell. I jumped the gun with my MARKET TOP signal about a month ago (see Red arrow). The indicator below is the MACD - note the red line is still above the blue line. Also note that the market has been losing momentum (red histogram bars) since about the time of my first warning in early August.
So, what now? This week is option expiration week and a major holiday, as well. Typically, that is bullish - and we have started off the week with a good rally. So, it is likely that we could rally into the holiday and into option expiration - but there is a problem. If we rally higher and close the week at a level above the upper channel line, we have to consider that the market may be breaking out to the upside. In my work, I look for two closing bars above a major channel line to confirm such a breakout. On the weekly chart, that would require waiting until the end of next week for confirmation.
The following two charts are daily charts for the S&P 500 and the Dow Jones Industrials. The S&P 500 daily chart has broken above the trend line from the October 2007 all-time high and has closed above that line for three consecutive days and is now above the line again. So far today, it has not made a new high. The DJIA had made a new high today, but just broke above the line for the first time and may or may not close above it. I have a wonderful Elliott Wave count on the Dow Jones Industrials chart, but it is incorrect - so ignore it. The (4) wave is below the (1) wave and that violates Elliott's rules - so as nice as it may look, it's wrong! Otherwise, the DJIA is running into the red trend line that has turned it away many times before.
This looks to me like we are running into a lot of resistance both in the shorter term trend lines as well as with the longer term upper channel line. However, you must keep in mind that we are in a seasonally positive time for the market and that the market may be attempting to break out to the upside. Therefore, you have to give the market the benefit of the doubt in both directions. In my view, this is a time for extreme caution and a time to utilize all the disciplinary tools at your disposal.
With respect to the economy, it seems like almost all of the stimulus money was used to prop up the banks that were deemed "too big to fai"". That's great, but it leaves all the other banks open to fail. So now you have 8,000 or so regional banks and private institutions that are essentially defenseless against the onslaught of commercial and residential loan defaults. A number of industry analysts and experts feel that as many as 2,000 bank could fail - this being set to happen at a time when the FDIC is almost belly up.
This market has had a habit of making bad news good news. I have seen that happen before, so this isn't a first, however, it is a practice that is short lived because, sooner or later, reality will set in.
I have long suggested that investors define their safe money and be sure that it is truly safe. That used to be easy to do - that is no longer the case. Heretofore, the investor could buy Treasury instruments and money market funds and just hold them in his bank or brokerage account. Now, we have seen what has happened to some previously outstanding banks and brokerage houses. You now have to realize that we are in a much different time in the cycle. When the first barrage of failures occurred, moves were made to shore things up through the stimulus plan and by taxing America. Now, it is a much different story. The funds that were used before are now just about gone - and, my bet is that the American taxpayer may get damn good and mad about shouldering yet another load that was created by others.
Getting back to the problem - investors need to get their "safe money" safe. Now you have a really big problem with that objective.
a) It is very easy to make a sound argument that Treasury instruments and money market funds are nowhere near as safe as they have been in the past.
b) The next problem is finding a safe custodian to park your safe money in. These are two much bigger problems than you might expect. Consider the following:
1) If you think buying Treasury instruments is a good idea, consider that you are buying debt (being a creditor to) from the largest debtor nation on the planet. If you were not a US citizen, would this still be your choice?
2) An alternative would be purchasing money market funds. Some estimates show derivatives to be a quadrillion dollars. It doesn't matter what the real number is (no one knows anyhow) - when some analysts put derivatives at that figure -- and virtually all analysts have it deeply into the hundreds of trillions -- we know one thing: a great deal of that paper has no value. So the real question is "Are you absolutely certain that the money market funds you are in have all of their 'paper' valued at 100% of dollar equivalent value". Obviously, money market funds are not supposed to be discounted - they are always supposed to be 100% of your investment plus interest. So, do you have investment vehicle risk? Do you have currency or 'purchasing power' risk? The honest answer to both is 'yes'. The only real question is "Are you going to do anything about it?" Do you know what to do about it? Are you pleased being highly speculative with your safe money in this economic environment? You will have to answer that one.
3) The US dollar will not remain the reserve currency for the world much longer. There will be a transition period - transitions usually are not much fun. Do you suppose things will get more negative or more positive as we move closer to when the US$ loses its reserve currency status?
4) The US dollar has consistently dropped in value since 1913 when the Federal Reserve was established. From that time it has lost 96% of its purchasing power. That is a pretty long and proven trend.
5) The FDIC is just about broke. Since the Stimulus Plan, 47 more banks have been wiped out in just three months. There are 91 banks that have gone under just this year. The pace of bank seizures is accelerating.
Here's a frightening thought: The government is now becoming your "partner" in banks and other financial institutions, in the auto industry, in the health care industry, etc. If this is "creeping Socialism", it's creeping pretty fast. It might be OK if the government had a wonderful record of success with all of its business ventures, however, the government may be the all-time worst manager of business. It can't even run the post office and our country has been a raging failure in a business sense for a long time. We have extreme
debt. It is OK to take on debt if you are making large profits and need the debt to expand your business and make more profits - and then pay down the debt - but that's not what our government does. We run big losses (deficits) and then take out huge loans to cover the losses. We are, by the way, very consistent in that process. In fact, that's how we do it. It is a prescription for failure.
This week has "Turnaround Tuesday" and I am flying to Southern California later for a few days. The market is pretty good about doing something wild when I am in an airplane or otherwise busy and not being able to be right on top of things. So, who knows, maybe it will be an exciting day. Otherwise, I think we have covered the outlook sufficiently earlier.
Last edited by a moderator: