Intraday Trading the Forex market to make consistent profit

For MM: I have everything else disabled so you can just focus on the main thing.

Like i said, the TurtleTraderChannel ist the one with changing blue to red (20) with small gold (5). The green one is a normal Donchian 55.


It needs to change colours and than the first break of the golden line to search for entries. The first arrow is a fakey and should be stoped breakeven if possible.
Second one is in the timezone and the two candels are exactly 20p so there should be at least 10p in the pocket.

Third one is again a fakey but it is pre german DAX opening. So no trading there.
The fourth is good. Nice entry, run of 20p a pullback and than again down.

The fifth and the last one is again a good entry point. Higher high, pullback with a higher low.


That picture is from yesterday evening - today and like you can see its a range of <50p the whole 2 days. It´s a trendfollowing idea, so in a range it could not work like in a nice trend but for a 45p range it would be a nice >30p.

If you have questions, just ask.

ty very interesting!
 
Example
 

Attachments

  • TRO.png
    TRO.png
    53.1 KB · Views: 430
Hi Tro

The 3 lines you mentioned - horizontal S / R level - white - and the red and blue horizontal lines are my bid / ask price with spread on GU normally under 1 pip

Look forward to your video etc

The 3 quick white Lrs will get you entries and exits on scalps - especially in time windows and at interim S or R levels.

The red / yellow / green - show longer moves and the then the 2 longest are really for structure over a session.

As you have seen - if all are over price in correct order - a bigger price fall - if all are under price in correct order - a larger price rise - if order out of sync - shows moves might be false or against normal structure and looked upon as stop hunts - before retraces

There is a lot of discretionary work to bear in mind as well - ie as the interim low or high held 30 mins with no breach - is PA working against the LR's - showing manipulation for stop hunts - are we in a tease or NTZ - No Trade Zone - or as I call them BTTZ - bermuda triangle areas - designed to tease either way to trap traders in one way or the other - etc etc - and those parts i am sure cannot be written in to a fully automated system

Still - if it can be made workable for a start - then the fine tuning extra's can be added

Good Luck TRO - with this method - you could drain the Banks ;-)


Regards

F

I am not sure of "correct order" or "structure". Can you define these concretely?

F, I am NOT attempting to automate this. The purpose of the indicator is to give the trader a HEADS UP when the pieces are "aligned". Then the trader can look at the appropriate chart and make the trading decision.

What defines the S/R level?

S/R LEVEL CAN BE ANYTHING THAT HAS SHOWN SOME SOLIDITY I BELIEVE.IE INTERIM SUPPORT OR LONGER STRUCTURE lines. I ALSO TAKE SUPPORT OFF Longer LR lines as well
 
F:

To code, I need clarity...

1. We need to have price moving up or down the previous 30 mins - with at least 2 or 5 mins of good movement

PRICE IS ALWAYS MOVING UP OR DOWN... PLEASE BE SPECIFIC

2. It needs to be ideally in a time window

Between HH:51 - HH:00, HH:09 - HH:21, HH:30 - HH:39, CORRECT?

3. Price need to hit a S or R - it can be horizontal - of any nature - ie fib level or just a scalp interim level - or it might be a dynamic S or R level - off a trendline or a strong LR / MA - etc

TOO VAGUE, NEED SPECIFICS


4. Ideally price need to be OB / OS on under 30 min frames

OB/OS BASED ON WHAT EXACTLY?

5. Is there any divergence going on ?

DIVERGENCE WITH WHAT? AN INDICATOR? VOLUME? ANOTHER PAIR?

6 Are we stopping for a LH or a HL ?

BASED ON WHAT EXACTLY?

7. Are we in a fade out or false move - I did post a GU chart on I think Friday of a perfect false wave - set up to confuse and catch traders out

?????

8. Will price structure support my planned scalp ??

DEFINE SUPPORTING PRICE STRUCTURE

9 Have we breached under or over a 1 min trend line and done a HH and HL in under 4 minutes?

TRENDLINE BASED ON WHAT? HH/LL OVER THE LAST 4 ONE MINUTE BARS??

10 Have we gone over 30 mins without a new interim low or high ?

BASED ON HOW MANY PREVIOUS BARS??


F, please do not take this the wrong way. In order to code it, it has to be defined. Can't be nebulous.

Of course, F, you don't have to answer if this is too much. I realize there are other things more important to you.

Thanks F, for all you have shared to this point.
 
S/R LEVEL CAN BE ANYTHING THAT HAS SHOWN SOME SOLIDITY I BELIEVE.IE INTERIM SUPPORT OR LONGER STRUCTURE lines. I ALSO TAKE SUPPORT OFF Longer LR lines as well

Hello MM:

You would have to define SOLIDITY.

I realize it is sometimes difficult for traders to put what they do in writing. To describe what they see in sensory specific language. This is where being a programmer AND a trader gives me an "edge". I can view trading with systems analyst eyes as well as trader eyes.
 
hello mm:

You would have to define solidity.

I realize it is sometimes difficult for traders to put what they do in writing. To describe what they see in sensory specific language. This is where being a programmer and a trader gives me an "edge". I can view trading with systems analyst eyes as well as trader eyes.

the attachment illustrates some of the points.
 

Attachments

  • cT_cs_9481368_EURAUD_2014-05-15_00-22-56.png
    cT_cs_9481368_EURAUD_2014-05-15_00-22-56.png
    189.2 KB · Views: 237
Last edited:
1) I take this to mean range is not tight and there is volume in the market
2) yep
3) see charts for examples of relevant lines
4) I dont know how F does this unless he is referring to LR
5) anything you choose
6) for me this depends on context. Ie are we turning at a low made 3 hours ago or perhaps in the context of the last 5 mins action
7) see F comment about pa being against longer lr structure
8) I take this to mean what does the last hour pa say to you. I could be wrong
 
F:

To code, I need clarity...

1. We need to have price moving up or down the previous 30 mins - with at least 2 or 5 mins of good movement

PRICE IS ALWAYS MOVING UP OR DOWN... PLEASE BE SPECIFIC

2. It needs to be ideally in a time window

Between HH:51 - HH:00, HH:09 - HH:21, HH:30 - HH:39, CORRECT?

3. Price need to hit a S or R - it can be horizontal - of any nature - ie fib level or just a scalp interim level - or it might be a dynamic S or R level - off a trendline or a strong LR / MA - etc

TOO VAGUE, NEED SPECIFICS


4. Ideally price need to be OB / OS on under 30 min frames

OB/OS BASED ON WHAT EXACTLY?

5. Is there any divergence going on ?

DIVERGENCE WITH WHAT? AN INDICATOR? VOLUME? ANOTHER PAIR?

6 Are we stopping for a LH or a HL ?

BASED ON WHAT EXACTLY?

7. Are we in a fade out or false move - I did post a GU chart on I think Friday of a perfect false wave - set up to confuse and catch traders out

?????

8. Will price structure support my planned scalp ??

DEFINE SUPPORTING PRICE STRUCTURE

9 Have we breached under or over a 1 min trend line and done a HH and HL in under 4 minutes?

TRENDLINE BASED ON WHAT? HH/LL OVER THE LAST 4 ONE MINUTE BARS??

10 Have we gone over 30 mins without a new interim low or high ?

BASED ON HOW MANY PREVIOUS BARS??


F, please do not take this the wrong way. In order to code it, it has to be defined. Can't be nebulous.

Of course, F, you don't have to answer if this is too much. I realize there are other things more important to you.

Thanks F, for all you have shared to this point.

This post has me puzzled TRO.
Why would you spend so much time coding these ideas if you can't already see the potential in F's strategies? (I'm not saying there is any) Just putting it out there !

PS. I posted on youtube to your Obama vid with some vid links and some reading materials you may enjoy. Let me know what you think.
 
Last edited:
This post has me puzzled TRO.
Why would you spend so much time coding these ideas if you can't already see the potential in F's strategies? (I'm not saying there is any) Just putting it out there !

PS. I posted on youtube to your Obama vid with some vid links and some reading materials you may enjoy. Let me know what you think.

If I didn't see any potential then I would NOT be coding...
 
Morning Tro

Seen the questions you have raised - and i will try and be as specific as possible with my answers during the day. Some with be easy - and MM as mentioned already a few - others I will try and give recent examples on the currency pairs we have been looking at.

Regards

F
 
Thanks, F.

Like I said, I understand you have other things to do... no hurry, no worry, Mate... Cheers!
 
Thanks, F.

Like I said, I understand you have other things to do... no hurry, no worry, Mate... Cheers!


Will be starting on it tonight

What might assist on a few of the points is our debate on the GU in the other live thread after midday UK time

Also some good comments from MM and other guys on reading price etc - and how we all see it differently etc

So recent examples there today on GU of price structure - based on LR's and supports and of course time

OK - more to follow over next few hrs

Regards


F
 
F:

To code, I need clarity...

1. We need to have price moving up or down the previous 30 mins - with at least 2 or 5 mins of good movement

- its the "bouncy ball" effect - a quick 5 -15 pip move in under a few mins will have a pullback - so ideally quick moves prior to time windows can be false

2. It needs to be ideally in a time window

Between HH:51 - HH:00, HH:09 - HH:21, HH:30 - HH:39, CORRECT?

[B] Correct[/B]

3. Price need to hit a S or R - it can be horizontal - of any nature - ie fib level or just a scalp interim level - or it might be a dynamic S or R level - off a trendline or a strong LR / MA - etc

[B] I use interim levels - ie that last pauses or cluster of price shown on a 1 min chart created by last movments - or ones of earlier the same or previous day[/B]


4. Ideally price need to be OB / OS on under 30 min frames

OB/OS BASED ON WHAT EXACTLY?

Can be at LR 2 ( infamous leading indicator one - only off a FX Trek Inteelichart pro chart - or an OS / OB oscillator on chart frames up to 1 hr

5. Is there any divergence going on ?

DIVERGENCE WITH WHAT? AN INDICATOR? VOLUME? ANOTHER PAIR?

Divergence from even a 4 hr chart oscillator ie RSi or others - not bothered with volumes - time gives me volumes

6 Are we stopping for a LH or a HL ?

BASED ON WHAT EXACTLY?


HH / HL/s on a 1min chart

7. Are we in a fade out or false move - I did post a GU chart on I think Friday of a perfect false wave - set up to confuse and catch traders out

?????

[B]Difficult one to explain - will find an example[/B]

8. Will price structure support my planned scalp ??

DEFINE SUPPORTING PRICE STRUCTURE

[B]My Lr price structure forecast on a 1 min chart - is there room either side for at least say 10 -15 pips - don't go with trades after 5 pips max
[/B]
9 Have we breached under or over a 1 min trend line and done a HH and HL in under 4 minutes?

TRENDLINE BASED ON WHAT? HH/LL OVER THE LAST 4 ONE MINUTE BARS??

[B] Trendline based off last change in time window and withh price staying above or below[/B]

10 Have we gone over 30 mins without a new interim low or high ?

BASED ON HOW MANY PREVIOUS BARS??

Purely clock time - ie say 11 03 am to 11 34 am


Hope this explains more

Will find some examples

A good one today is GU

Up to 9 00 am this morning - UK time a sell

From 6735 + - GU became a buy that lasted most of the day


.


Hi Tro

First attempt

pleased the trigger points for entries are helping you


Regards


F
 
Last edited:
GU - example for Tro's questions 7 and 8

174808d1400274836-intraday-live-short-term-trading-calls-expert-retail-forex-trader-gu-165142.jpg


Morning TRO

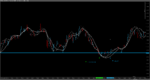
I am going to use the GU from Thursday 15th and yesterday -( chart above) Friday 16th.

A great example of a manipulated or false move set up from say 10 00 am UK time to after 11 51 am when the GU was in a bullish structure above Thursday's low area of 6735 - 50 and then on Friday had continued bullish up above 6800+ and with the 3 longer Lrs - ie the white dotted - green dotted and green line all in a bullish structure - on above the other.

When price was tried to take below 6800 and then 6780 - this was totally against the LR structure for that last 4-12 hrs - and although it was a clear scalp sell down to the support area - it was in fact -

1 - a stop hunt on existing intraday bulls who had been buying since the Opens

2, An organised attempt to get more bears in - and then of course - fry them

3. Nothing illegal - if you have the money you can move price anyway - but obviously retail traders and small commercials cannot do it - only liquidity providers and larger players

4. the main objective was to take the buys of existing traders - get bears in - have them both and then the players are able to buy again at a lower price - so to make more money.

5. So i am scalp selling after 10 30 - 11 00 am time - but knowing that this move will turn - at a support area and then it will be a buy again

6. My quicker white Lr's and the red Lrs follow the fall as a scalp sell - but then when they go back under price - time to buy again and then load on more as the proper bullish LR structure appears on the 1 min - ie whites - then red - yellow - green and then dotted gree and dotted white .

7. As we stand on Friday US session - the GU was a scalp sell after 6844 top - but as you can see on this chart - more than likely supports will hold again - and then price will rise again from 6800 area

8. We would need the scalp sell to breach under 6800 and 6780 to hold for longer sells - and more than likely we will turn - and then try up for 6840+ again - and either do a LH - and another drop - or breach 44 and 6850 - and try higher again

LR 1 min structure assists me to read PA better and to plot future waves

I am not fortune teller - ie try to guess daily or weekly movements - as its not so profitable - needing larger stops and longer time to make trades with RR's of 3+

Hope this make sense to you - and please fire away the next questions


Regards

F
 
Last edited:
"6. My quicker white Lr's and the red Lrs follow the fall as a scalp sell - but then when they go back under price - time to buy again and then load on more as the proper bullish LR structure appears on the 1 min - ie whites - then red - yellow - green and then dotted gree and dotted white ."

Good day, F:

The above helps because it is specific...
it can be coded:

3 whites < red < yellow < green < dotted green < dotted white

Now can you confirm my colors are correct - lines are labeled and the gauge shows same values.

Thanks F

eurusd-m1-forex-capital-markets-2.png


Yes - set up looks OK

I am posting a EJ chart from this morning giving you n example of a direction bias change at 9 00 am UK time on it - and you will see the change in structure


174862d1400493164-intraday-live-short-term-trading-calls-expert-retail-forex-trader-ej-19514.jpg
 
Top