InTheMoneyStocks Market Analysis

Regional Banks Still Look Like Dead Money

As we all know the major stock market indexes found a short term low in early July. Since that time the major indexes have bounced around six to eight percent. Many investors are saying the worst is behind us and the correction that began in April is now over. While the major market indexes have certainly bounced it does seem a little early to wave the all clear sign. The one reason that I say this is due to the poor action in the regional banks. So far in 2010 the FDIC has reported 96 bank failures which are all regional banks.

Hudson City Bancorp Inc (NASDAQ:HCBK) reported earnings today and is receiving a poor reaction from traders and investors. The stock is trading lower by 0.30 to $12.40 a share. The daily chart on this stock looks weak and remains under the 20, 50, and 200 moving averages. The stock will still have daily chart support around the $12.00 - $11.75 area.

Regions Financial Corp (NYSE:RF) is actually trading higher this morning by 0.17 to $6.71. While this stock is trading higher today the daily chart still looks weak. Regions Financial Corp made a low pivot on July 7th at $6.12 and is not that much higher from that level today. The stock is still trading below the important daily 20, 50, and 200 moving averages. As long as early July low holds up the stock may just chop around until it reports earnings on July 27th.

SunTrust Banks Inc (NYSE:STI) is another regional banks that is trading higher today by 0.01 to $23.08. This stock looks terrible on the charts as it is also trading below the daily 20, 50, and 200 moving averages. The stock found support on July 1st when it traded as low as $21.79. A solid break below that pivot low level the stock should test the $20.00 support area. Suntrust Bank Inc is scheduled to report earnings tomorrow.

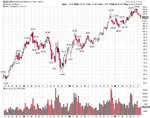
These are just a few leading regional bank stocks that many traders and investors follow. As you can see these stock all look very poor on the charts. As we all know loan demand is down significantly and unlike the large major banks these banks cannot borrow from the Federal Reserve Bank at zero percent. This disadvantage will certainly weigh on the regional bank stocks. If traders just watch the SPDR KBW Regional Banking ETF (NYSE:KRE) you can see that the daily chart looks just as poor as the leading regional stocks.


Nicholas Santiago
Chief Market Strategist
www.InTheMoneyStocks.com
 
Psychology And Sentiment Whip Markets

Federal Reserve Chairman Ben Bernanke testified yesterday, scaring the markets with his words. His comments were all bearish in regards to the economy and the recovery. He eluded to keeping rates low for a long time to come as the recovery was going to take far longer than anyone had thought. After saying this, the markets fell off a cliff, selling sharply and closing near their lows. Today, the markets are having a huge rally. It is as if nothing happened yesterday. What is the difference between yesterday and today? Frankly, nothing has changed but the markets continue to react in the opposite direction of the retail, amateur trader. As soon as the market psychology gets bearish, the markets reverse. As soon as market psychology gets bullish, the markets reverse again. Black box trading programs, hedge funds and big financial trading desks have taken the market whips to new heights. Just look at the moves in the last three days. The SPDR S&P 500 ETF (NYSE:SPY) on Tuesday gapped down to $105.87 and closed the day at $108.48. Wednesday, the markets gapped higher to $109.04, then reversed to close at $107.07 after hitting a low of the day at $106.63. After closing yesterday at $107.07, the SPY hit a high today of $109.85. Talk about whips! If you did not have your seatbelt on you would be in major trouble. This price action is likely to continue in the near future. The whips are being helped by uncertainty and mixed economic news. We alerted our subscribers that this type of crazy action was going to take place. This keeps us with very short term swing trades so we can maximize the profits. To get more analysis, guidance, education and trades, join the Research Center.

Gareth Soloway
Chief Market Strategist
www.InTheMoneyStocks.com

SPY07_22_10.jpg
 
Possible Genzyme Buyout Could Spike Small Cap Bio

Rumors are swirling around a possible buyout of Genzyme Corporation (NASDAQ:GENZ) by Sanofi-Aventis SA (NYSE:SNY). Since Friday, Genzyme has jumped from $54.00 per share to a high today of $67.69. As buyout frenzy hits Wall Street and specifically biotechs, small cap dead bottom biotechs may get some play.

One of these dead bottom plays are Poniard Pharmaceuticals, Inc. (NASDAQ:pARD), which is trading near its 52 week lows and below cash. In addition it was voted best of the ASCO conference. Other interesting micro cap plays trading near their lows are Threshold Pharmaceuticals, Inc. (NASDAQ:THLD), OXiGENE, Inc. (NASDAQ:OXGN) and Uluru Inc. (AMEX:ULU). Keep a close eye on these in the coming days. Some are upticking today already.

With a buyout of Genzyme looming, it may also signal that many large companies sitting on massive amounts of cash may be looking to spend it. This may mean other stocks in other sectors, trading on their dead bottoms could bounce. Stay tuned to this interesting story on Genzyme. I am on small cap bio alert at this point, watching for anything of interest.

Gareth Soloway
Chief Market Strategist
www.InTheMoneyStocks.com
GENZ07_26_10.jpg
 
Gold Continues To Turn To Dust For Retail Longs

The collapse of gold continues as the SPDR Gold Trust (NYSE:GLD) is trading at $113.64, down -1.88 (-1.63%). Stocks like Freeport-McMoRan Copper & Gold Inc. (NYSE:FCX), Randgold Resources Ltd. (ADR) (NASDAQ:GOLD) and Agnico-Eagle Mines Limited (USA) (NYSE:AEM) are all getting hammered. Gold has dropped off a cliff over the last month for many reasons, both technical and psychological. Technically, the simple answer is gold was extended on the daily and weekly charts, pushing to new all time highs almost daily. The more interesting side of the analysis is the psychological aspects. First, to fully understand this, one must understand the contrarian perspective and how big institutions will purposely push a commodity, stock or market in one direction to the max, in order to get the small, retail investor and mutual fund in that direction. It makes perfect sense if you think about it. Institutions buy a massive amount of a position. The only way they can unload that size is if they get everyone else to buy that position as they sell it. Simply put, the gold trade was a perfect example of driving gold up, creating fear and panic to get the retail investor and mutual fund to load up on gold and sell right into them. Once the retail investor, mutual fund are long at the top, there are no other buyers to continue to push it higher and it will collapse. Just think of the buying hysteria that engulfed gold in the past six months. Truly a top.

When is the time to buy gold? Long term I have little issue with the fact that gold will rise higher. Five-thousand an ounce is not out of the realm in five years. However, the time to buy is when the retail investor and mutual fund are pushed to the limit and dump their positions. When everyone else hates gold, buy. Institutions will be.

In the short term, the major target for the GLD is the daily 200 moving average. This is at $112.00. To get more info, analysis, guidance and swing trades, join the Research Center.

SPY07_27_10.jpg


Gareth Soloway
Chief Market Strategist
 
Last edited by a moderator:
Re: Gold Continues To Turn To Dust For Retail Longs

Where can I find out information on gold funds that are open to the retail investor? I know I can google it, but I'd prefer that someone else does that for me.

Do you know of any major funds that are liquid and trade with a small bid/offer spread?
 
Re: Gold Continues To Turn To Dust For Retail Longs

As shown above the GLD is a good vehicle for investors. There is also the
DGP double long gold.
 
Re: Gold Continues To Turn To Dust For Retail Longs

The collapse of gold continues as the SPDR Gold Trust (NYSE:GLD) is trading at $113.64, down -1.88 (-1.63%).
Gareth Soloway
Chief Market Strategist

Thank You bar jon for removing his advertising link from his sensational headlined post!

Mr. Soloway,

Since when is a 10% price retracement a "collapse of gold"? I don't think so!

if you will show me how the current retracement is anything more than previous retracements. I am not a gold bug by any stretch of the imagination, but I dislike sensational headlines especially when they are used to bait unsuspecting people.

If you want to see a collapse of prices pull up a chart of most anything on May 6, 2010. Buyers left the trading arena for awhile, but you knew that, right?
 

Attachments

  • GLD.JPG
    GLD.JPG
    112.2 KB · Views: 227
Economic Data Sends Market On A Wild Ride

The big earnings announcements have subsided over the last week, but the economic reports continue to flow. Today, GDP was reported for the second quarter, 2010. It came in around the estimates at 2.4%. The futures sold sharply. Why did the futures sell sharply on a GPD number that came in line with what Wall Street had expected? Because GDP for the first quarter of 2010 was revised upward to 3.7% from 2.7%. What? How does that make sense? GPD being revised upwards is good news right? Not so fast. GDP of 3.7% in the first quarter, compared to GDP of 2.4% in the second quarter means now there is a significant slowdown in progress again. This leads many to think that double dip recession is in play.

The markets gapped lower with the SPDR S&P 500 ETF (NYSE:SPY) hitting $108.98 within the first few minutes of trading. This was a drop of $1.31 for the day. The Dow Jones Industrial Average was down more than 100 points.

Then came more economic data. At 9:45am ET, Chicago PMI was reported to be 62.3. Analysts had expected a much lower number. That markets surged higher. In addition, word came out that BP plc (ADR) (NYSE:BP) would set aside $100 million unemployed rig workers. That helped fuel a short squeeze. At 9:55am ET, University of Michigan Sentiment was reported to be 67.8, also higher than economists had expected. The markets continued to squeeze.

By 11:00am ET, the markets had erased a 100+ point drop on the DOW and were in positive territory. Truly an amazing move as shorts were caught off guard once again. In the last hour, the markets had stalled and are now beginning their sideways trek around the flat line. This is now looking like a typical Friday mid day session with many traders starting to head out for the weekend. Volume should continue to decline and a flat day is expected on the markets.

Gareth Soloway
Chief Market Strategist
InTheMoneyStocks.com
SPY07_30_10.jpg
 
Market Master Report - Major Levels Alert!

The PowerShares QQQ Trust, (ETF) (NASDAQ:QQQQ) lost just 0.25 cents for the week ending July 30th, 2010. Last week started higher and then faded throughout the week. On July 30th the technology heavy ETF opened sharply lower only to reverse all of the early loses and close positive on the session. Therefore, the index could see some early strength this week. The QQQQ's and the other major indexes rallied nearly 10 percent for the month of July and this is very impressive by all standards. However, the volume during this move higher has been very light which could signal lack of conviction by the institutional money. This week could go either way by the current chart pattern in place on the weekly chart. The negative for the QQQQ's are that it is still trading below the weekly 20 moving average and below the June pivot high. Both factors are signs of a weak technical positions on the chart. The weekly support level for the QQQQ's is still the $42.00 area which is the July low. The current weekly resistance area will be the $48.00 level.
qqqq%207_31_10.bmp


The United States Natural Gas Fund, LP (NYSE:UNG) has come back into play ever since the BP plc (ADR) (NYSE:BP) oil leak began in the Gulf of Mexico in late April. While natural gas is in abundance in the United States oil is still the primary energy source of choice. Natural gas has been promoted as the clean energy source. However, the retrieval process is known to cause many pollutants; as we have seen all deep drilling carries risk dangers to the ground and to the water systems. This past week United States Natural Gas Fund (NYSE:UNG) closed solidly above the weekly 20 moving average and this is a short term sign of strength. The weekly resistance levels for the United States Natural Gas Fund are $8.80 and $10.00. The weekly support area for the UNG will be $7.30 and $6.70.
ung%20weekly%207_31_10.bmp


Potash Corp./Saskatchewan (USA) (NYSE:pOT) has now staged a four week rally continuing its winning ways in July. This move higher comes as the U.S. Dollar Index plummeted by 4.5 points in the month of July. As we all know the agriculture stocks are very inflationary in nature and often trade much like a commodity stock. Therefore, when the dollar declines sharply the agriculture stocks will often inflate higher. Monsanto Co (NYSE:MON) has staged its best rally in 2010 during the month of July as well. Therefore, it is rather obvious that the weaker dollar was the determining factor to the stronger agriculture sector this past month. Potash Corp will have minor weekly chart resistance around the $107.00 area and much stronger resistance around the $111.00 level. Should the stock reverse lower from here the weekly support area for Potash Corp is around the $92.50 level.
pot%20weekly%207_31_10.bmp


Halliburton Co (NYSE:HAL) has rebounded sharply higher since early June when the stock traded as low as $21.10 a share. This past week the stock traded up into the weekly 200 moving average around the $31.00 level and this served as short term resistance. The stock still looks strong on the charts in the near term, however, important resistance levels are very close. Halliburton Co will have near term daily chart resistance around the $32.00 area. Should the stock trade above that level then the weekly resistance level at $35.00 should come into play.

hal%20weekly%207_31_10.bmp
 
Inflation Rally Thrives Another Day

This morning the major stock market indexes are all trading sharply higher before the open. The catalyst for this early rally by the media is the as positive news out of China. While the China news might be what the media points to as the catalyst for a rally it is the weakening U.S. Dollar Index that is the catalyst if you ask me. This morning the U.S. Dollar index is trading lower by another 0.35 cents to $81.17. The U.S. Dollar has now declined over $7.50 from it's June high when it traded as high as $88.70. As many of you know when the dollar declines the major stock market indexes inflate higher. The SPDR S&P 500 Trust (NYSE:SPY) and the SPDR Dow Jones Industrial Average (NYSE:DIA) are now higher by more than 10.0 percent since the July low pivot.

The stock market has become a market of extreme swings in both directions. When declines or sell offs occur they are usually violent in fashion. Just look at the May 6th flash crash when the Dow Jones Industrial Average lost nearly 1000 points in a few hours before recovering over half of the intra-day decline. Take this recent rally from the July lows as another example of an extreme move higher. A few years ago a ten percent move was the most that an investor could expect for the year in an index and now we see that type of rally in less than thirty calendar days.

Remember the declining dollar is the driving force behind ever stock market move higher. Certainly a positive Shanghai Index(China) trading higher does not hurt the inflation rally as many believe that China is the savior of the market right now. Remember as long as China continues to grow investors believe that they will consume more commodity products. Just look at Cliffs Natural Resources Inc (NYSE:CLF) which is a leading iron ore pellet producer and you can see the stock is trading higher by 2.03 to $58.61 a share. When China rallies higher expect the commodity stocks to rally as well. Right now stock the stock markets are holding up well. However, when the music stops playing in the communist nation and the bloated fiat currencies around the globe start to lose there inflationary power this rally should come to an end.

clf%208_2_10.bmp


Nicholas Santiago
Chief Market Strategist
www.InTheMoneyStocks.com
 
August Drama Is Just Heating Up

The stock market indexes all surged higher yesterday clearing above important technical resistance levels. Yesterday's rally higher was broad based and very powerful point wise. At face value it looked very impressive. The catalyst for the rally yesterday was a strong Chinese market and a weak U.S. Dollar Index. This seems to be the perfect short term elixir for stock market upside. Who would have ever believed that a stronger Chinese economy would benefit the United States? Who would have ever believed that a weaker U.S. Dollar would really benefit the United States in the long run. The truth of the matter is that these are just short term or temporary fixes to the United States economy.

The goal for the U.S. Treasury and the Federal Reserve Bank is to inflate the economy back to health. This has been tried by many other countries prior with very little success. Japan is the most notable government that has tried to fight deflation with artificial inflation and they have basically flat lined for the past 20 years. What will happen to the United States if China stops growing at a double digit rate? What will happen if the U.S. consumer stops buying so many Chinese goods. The U.S. consumer seems to hold all the cards as they are the largest consumer of goods in the world and consumer spending accounts for up to seventy percent of the GDP in the United States.

China is now facing many headwinds as they have been growing for many years now. Recently China faced an uprising from several workers in the auto industry. Honda Motors LTD (NYSE:HMC) auto workers staged a strike over wage increases and work conditions. Similar disputes have emerged with Toyota Motors Corp (NYSE:TM), and Bayerische Motoren Werke AG(BMW) workers. The Chinese government has also had a long dispute with Google Inc (NASDAQ:GOOG) over censorship which is extremely important worldwide. These are just some of the problems that are beginning to emerge as this large Chinese economy matures. Double digit growth will not last forever as the new middle class begins to grow and will demand more pay and better work conditions.

Last night the Shanghai Index traded lower by 1.71%. Today the U.S. stock market is trading slightly lower retracing some of yesterday's huge advance. Today the U.S. Dollar Index is trading lower by 0.25 cents to $80.67. The weaker dollar will usually help to inflate the stock market higher. When the dollar declines commodity stocks such as Southern Copper Corp (NYSE:SCCO), and AK Steel Holdings Corp (NYSE:AKS) will usually jump higher. However, should the dollar rally higher these stocks will usually decline and sell off. The month of August will not be the normal summer doldrums as the Chinese market will come under the microscope and the U.S. Dollar Index will be nearing important daily chart support levels. Stay tuned the next few weeks should be filled with volatility.

$ssec%208_3_10.bmp

Chart from CNBC.com

Nicholas Santiago
Chief Market Strategist
www.InTheMoneyStocks.com
 
Everyone Awaits the July Job Report

This morning the major stock market indexes are slightly under pressure after the weekly initial jobless claims report was slightly worst than expected. While this economic news is important most traders and investors will have their eyes fixed on tomorrow's government July job report that will be released at 8:30 am EST.

Economists are looking for growth in the private sector to increase by 80 thousand jobs. When you think about the month to month revisions and the amount of people that have fallen off the unemployment list who can really make heads or tails of this report. There is also a fair argument that the report is inaccurate and the numbers are never correct anyway. However, for some reason Wall Street loves this report and an initial reaction is imminent after the announcement.

Today many retail stocks reported there yearly comps and many of these stocks are trading lower today. This report is a better barometer for the economy than the monthly job report. The entire inflation rally that the Treasury and the Federal Reserve Bank are planning on will only last if the consumer begins to spend money. It is important to remember that consumer spending accounts for 70 percent of the gross domestic product in the United States.

Today the retail sector is mixed as some stocks such as Kohl Corp (NYSE:KSS), and Target Corp (NYSE:TGT) are trading higher on the trading session. Other leading retail names such as Nordstrom Inc (NYSE:JWN), and J.C. Penney Inc (NYSE:JCP) are trading lower today. When the retail stocks trade sharply higher and rally for an extended period this tells us that the U.S. consumer is spending and feeling better about the economy. When the retail sector lags and trades poorly this tells us that the U.S. consumer does not believe that the economy is strong. Just look at how the retail sector traded during 2009. It was very strong and so was the market. Now look at how the retail sector has traded during 2010 and you will see that this sector has been weak. As you may have noticed the overall stock market has been weak in 2010.

jcp%208_5_10.bmp


Nicholas Santiago
Chief Market Strategist
www.InTheMoneyStocks.com
 
Apple Caught In A Tight Range. Breakout Or Breakdown?

Apple Inc. (NASDAQ:AAPL) in the key range it created after reporting stellar earnings on July 20th, 2010. The trading day following those earnings saw Apple gap higher to the $265.00 range, only to sell off to $254.00 level into the close. That range has created what I call a box trading range. Since then, the stock has not traded outside of that range once. Instead it has bounced up to the $265.00 level, then back down to the $254 level. It continues to jump back and forth. The key will be when it breaks the range one way or the other. Should it break the $265.00 level, the stock should trade back to the 52 week highs at $279.01. If it breaks the lower box level at $254.00, expect the stock to fall to the 200 moving average, currently at $228.00.

Gareth Soloway
Chief Market Strategist
www.InTheMoneyStocks.com
AAPL08_06_10.jpg
 
Exxon Mobil is the Market

Today the major market indexes followed their usual pattern. The SPDR S&P 500 ETF NYSE:SPY) dipped lower during the first half hour of the day only to rally higher on light volume for the rest of the session so far. There were a couple of factors in the market that were telling us that the markets would trade this way. The first was the light trading volume ahead of tomorrow's highly anticipated FOMC meeting. Light volume always favor the upside action. Hence the old market adage, “never short a dull market”. It can't get more dull than this. The second and more important factor was the action in Exxon Mobil Corp (NYSE:XOM).

Exxon Mobil Corp (NYSE:XOM is the largest stock in the market with a market capitalization of $318 billion. Therefore, when the largest stock is strong it is a safe bet that the stock market will be strong as well. The stock is also a major Dow Jones Industrial Average component. While the Dow Jones Industrial Average is a price cap weighted index and not a market cap weighted index Exxon Mobil Corp still carries a lot of weight when trading above $60.00 a share.

The important point to remember here is that when Exxon Mobil Corp trades higher on the session rarely will the stock market trade lower. This stock is a very good stock market barometer and should be watched and followed even if it is not traded. When Exxon Mobil Corp trades lower on the session watch how the market remains under pressure.


Nicholas Santiago
Chief Market Strategist
www.InTheMoneyStocks.com

xom%208_9_10.bmp
 
Futures Pounded As Dollar Rips Higher Again

The futures are dropping sharply as the dollar is ripping higher this morning. The overall U.S. indexes are set to open sharply lower after the Federal Reserve saved the day yesterday by announcing they would start buying U.S debt. Yes, the thought of flooding the market with more liquidity caused an intra day massive drop in the dollar which helped the markets survive yet again. However, today seems to be reckoning day number two! Pre-market, the SPDR S&P 500 ETF (NYSE:SPY) is at $110.75. That is after a close at $112.38 yesterday. The dollar is also up sharply with the PowerShares DB US Dollar Index Bullish (NYSE:UUP) trading at $23.75, after closing at $23.52 yesterday. Always remember, there is an inverse relationship between the dollar and the markets. Dollar up big, markets down big.

Over the past week, including last Friday and yesterday, the markets tried to sell sharply. Each time they did, mysteriously the markets were saved, ripping up late in the day to close just fractionally lower. The Federal Reserve? The Plunge Protection Team (PPT)? Either way, it appears the market has made up its mind and wants to drop. They may not have any cards left to play now. Many stocks remain overbought at this point and the bounces can be shorted in my opinion. Stocks like Chevron Corporation (NYSE:CVX) and Amazon.com, Inc. (NASDAQ:AMZN) both continue to look bloated. The turn date given out to our subscribers looks to have been nailed once again. To get more information, guidance, analysis and swing trades, join the Research Center.

Gareth Soloway
Chief Market Strategist
www.InTheMoneyStocks.com

ES08_11_10.jpg
 
Re: Futures Pounded As Dollar Rips Higher Again

wants to drop? not so sure myself, it's a toughy and i've been eyeballing ES on that big resistance level, failed to push through but this 'sell off' , could just be a pullback in the trend we've been having recently, or it could be a reversal, if i hadn't heard the news this morning i would be going long right now the sp500. but not sure whether risk aversion is going to cause a long term reversal or not...again i'm watching that level...
 
Will the “Friday Effect” Save the Day?

This week has been a brutal decline for the major stock indexes such as the S&P 500, NASDAQ, and the Dow Jones Industrial Average. Yesterday the market indexes followed through to the downside declining even further closing at a new low for the week. However, today is Friday and rarely do we see the markets collapse ahead of a weekend when the market is closed. Please realize there have been some Friday's when the market indexes have tanked and closed down sharply although it is not often. If you check the number of Friday's over the past two years there have only been about a dozen that have been down by more than 100.00 points on the Dow Jones Industrial Average. Most Friday's end in a slightly positive or negative trading session usually near the unchanged level.

Why does this type of action occur on a Friday? First of all many traders especially in the summertime will usually leave after the morning trading session in the market on a Friday. Often traders and investors will get a head start on their weekend just trading for a half of the day. That is one of the reasons why the volume usually drops off sharply on a Friday. The second reason is that the institutions that can and do move markets rarely want to cause a panic over the weekend in the U.S. consumer. The weekend is when the U.S. consumer shops and spends money. Please understand that consumer spending accounts for 70.0 percent of the U.S. gross domestic product. Lastly, the institutional money does not want to put fear into the Asian markets over the weekend. At this time in history it is Asia and mainly China that many are betting on to lead the economic recovery. Remember China and Japan are the major exporters to the United States. If the Chinese markets begin to retract the U.S. and European markets will come under pressure.

Today the markets are trading slightly lower during the first 15 minutes of the trading session. It will be interesting to see where this market closes. Often a Friday is somewhat quiet and the close is usually around the unchanged level. Keep an eye on Exxon Mobil Corp (NYSE:XOM) as this stock is one of the best barometers for the overall market. If Exxon Mobil closes positive the market will usually finish in the green. If this stock closes down sharply usually the market will be down as well. Exxon Mobil Corp is trading flat today around the $60.20 area. J.P. Morgan Chase & Co (NYSE:JPM) is another important stock to follow as well. J.P. Morgan Chase is a leading financial stock that has been under a ton of pressure lately. The stock is now into some minor support on the daily chart and due for a short term bounce. If this stock catches a bid it will help lift the market indexes.

xom%208_13_10.bmp


Nicholas Santiago
Chief Market Strategist
www.InTheMoneyStocks.com
 
China Keeping the U.S. Markets Alive

This morning the major stock market indexes in the United States all opened very poorly. However, since the open we have seen most of these important indexes recover most of the early losses and actually trade around the unchanged level on the trading session. There a few reasons for this type of early recovery in the Dow Jones Industrial Average, S&P 500 Index, and the technology heavy NASDAQ. The first reason is the weaker U.S. Dollar Index, and the second major factor is the strong Shanghai Index(China) last night.

When the U.S. Dollar Index trades lower most stocks and indexes will inflate higher. Leading commodity stocks such as United States Steel Corp (NYSE:X), and Cliffs Natural Resources Inc (NYSE:CLF) are both leading the markets higher today. Whenever the U.S. Dollar Index retreats these names can be played for possible bounces.

The Shanghai Index rallied higher last night by more than 2.0 percent. Whenever the leading Chinese stock index trades sharply higher many commodity stocks will instantly catch a bid higher. Most investors are betting that the continued growth in China will help keep building very strong. Therefore, China will need to keep purchasing commodities and materials. China has continued to post strong GDP numbers over the past year and the market is following their every move.

Who would ever believe that China would be the driving force behind the U.S. stock market? Believe it or not the time has arrived when China is leading the world economically. As we all know China has financed much of the debt of the U.S. government for years now. However, the global stock markets are now depending on this country to carry the global markets higher. Keep an eye on the Shanghai Index going forward. When this index rallies the rest of the markets around the world will usually hold up. When the Shanghai Index declines and corrects the rest of the world indexes usually declines sharply lower.

fxi%208_16_10.bmp


Nicholas Santiago
Chief Market Strategist
www.InTheMoneyStocks.com
 
Markets Shoot Higher But Are Now Into Resistance

The markets have rallied beautifully today on light volume and positive earnings and buyout news. Walmart reported great numbers and raised guidance while Home Depot reported better than expected numbers as well. Both stocks are soaring today. In addition, Potash received a buyout offer BHP Billiton Limited for $130.00 per share. Throw a pinch of light volume and a dash of weaker dollar and the markets have a beautiful concoction for upside action.

While the markets have jumped nicely, they are coming into some major resistance. The SPDR S&P 500 ETF (NYSE:SPY) is higher by 1.75 (1.62%) to $110.01. This happens to be right into the major 50 moving average on the hourly chart. This even number of $110.00 will also work as a master level for the markets. Note the chart below. For more analysis, guidance, swing trades and education, join the Research Center.

Gareth Soloway
Chief Market Strategist
www.InTheMoneyStocks.com

SPY08_17_10.jpg
 
Re: Markets Shoot Higher But Are Now Into Resistance

The markets have rallied beautifully today on light volume and positive earnings and buyout news. Walmart reported great numbers and raised guidance while Home Depot reported better than expected numbers as well. Both stocks are soaring today. In addition, Potash received a buyout offer BHP Billiton Limited for $130.00 per share. Throw a pinch of light volume and a dash of weaker dollar and the markets have a beautiful concoction for upside action.

While the markets have jumped nicely, they are coming into some major resistance. The SPDR S&P 500 ETF (NYSE:SPY) is higher by 1.75 (1.62%) to $110.01. This happens to be right into the major 50 moving average on the hourly chart. This even number of $110.00 will also work as a master level for the markets. Note the chart below. For more analysis, guidance, swing trades and education, join the Research Center.

Gareth Soloway
Chief Market Strategist
www.InTheMoneyStocks.com

SPY08_17_10.jpg

Price tested r3, failed, and is moving back down with volume leading price. Now below the 50sma on the hourly. Btw, nice looking board. Good to be here.
 
Top