InterMarketAnalysis
Active member
- Messages
- 178
- Likes
- 0
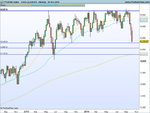
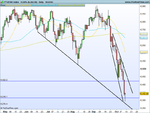
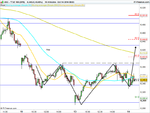
FTSE 100 - 10 mins chart , I expect the gap above to close @ 6430 region next week
so far I make that 3 losses of 100 and win of 5, 30 and 70
Not very good odds for your "subscribers" Wallstreet
risk 100 and return an average of 30 so a 1:0.3 risk/reward 😳
Do you give refunds?
Will any Mods intervene on this thread early?
 10m.png")
 daily .png")
FTSE 100 - 10 mins chart , I expect the gap above to close @ 6430 region next week
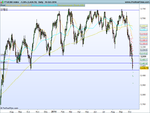
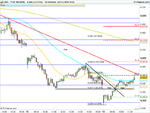
Now that weaker miners and mobile telecoms factored in and ftse long stopped -100
I am retaking long FTSE 6350
sl = 6250
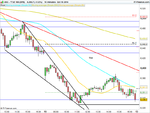
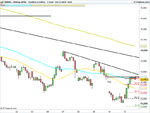
FTSE volatility back into key resistance
Gap closed @ 6340 region
now a potential reversal expected
I am swing short 6335
sl = 6435
tgt = 6235
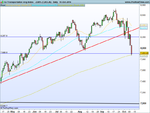
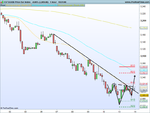
Bias change
shorts closed -10
switched to long 6346
sl = 6206
tgt = 6500 region
FTSE failed to fall even with Nasdaq and S&P 500 making a new low = inherent strength
IHS foramtion in play