Indicators are liars! Support and Resistance Trading for the S&P emini

aamarx

Well-known member
Messages
453
Likes
19
Many traders believe that to be successful you need mountains of indicators that give you some kind of "edge" over the market. I am here to say that trading as a means of consistent income does not have to be painful or difficult. That less is certainly more when it comes to trading. Ive met traders with every indicator under the sun on their charts, with years of training under their belts having spent thousands of $$$'s and STILL not making a consistent income....

Why? Because Indicators are liars! Sure sometimes you might pull of a trade or 2 but in the end you always get spanked....Why? Because not everyone uses a MACD with your settings, not everyone uses a Stochastics or an RSI. I believe to be an effective trader you have to look at what the majority of traders look at...So what do most traders look at? Support and Resistance! Almost every system out there uses Support and Resistance to some extent. Support and Resistance is our number 1 indicator. So why not make Support and Resistance your system?! Mark up some levels on a chart using time frames from 1hr and above (this is what the big boys who move the market watch, so no lower please) and see what happens! Use other info that the majority of traders watch ONLY as confluence, Market Profile levels, Pivots and Fibs.

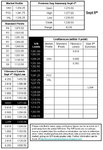
In the attached file is my daily worksheet, I will start posting this on the forum regularly as long as others find it of value. The levels described in the attachment are considered high probability areas for market "reversal", offering retracements of 0.75 points to in some cases 50+ points. In many instances historically referenced Support and Resistance levels can help traders catch markets tops/ bottoms to the very tick! Why? Because Support and Resistance levels are the most widely used trading tool! Everyone from Hedge funds and banks to the small time trader at home use Support and Resistance levels

It might be difficult to leave the system you are using now so why not use these levels as a guide alongside set ups defined by the system/strategy that you are implementing. All levels described have historical significance and thus considered high probability numbers. The numbers described are in a fairly large range to take account of market volatility. Throughout the trading day these numbers can become areas of Support AND Resistance.
 

Attachments

  • es-supportandresistance.blogspot 05-09.jpg
    es-supportandresistance.blogspot 05-09.jpg
    97.2 KB · Views: 3,295
Poppycock!

Hi aamarx,
The assertion that "indicators are liars" is total rubbish. On the contrary, given that most (all?) indicators are mathematical calculations based largely on price and volume, I would assert that indicators tell the absolute truth, always, 100% of the time. There is absolutely nothing wrong with indicators. The problem(s) - when there are problem(s) - lie exclusively with the trader. The problem(s) occur because the trader . . .
1. doesn't understand fully what the indicator does.
2. doesn't understand fully how the indicator works and what its limitations are.
3. doesn't understand fully how to apply - or not apply - what s/he thinks the indicator is indicating.
The trader who does understand fully points 1 through 3 may well be able to use their chosen indicator to great effect. I would add that all three points apply to support and resistance levels just as readily as they apply to MACD, RSI, CCI or whatever. S&R levels are useless to the trader who doesn't understand what they are, when and why S&R is likely to hold or be broken and how best to apply the knowledge that they think they have about S&R.
Tim.
 
Last edited:
All fair points.

What I would like to do in this thread is confront the compulsion newer traders have for the excessive use of indicators, using indicator as their CORE methodology. e.g. entering a trade because the MACD has crossed. You seem experienced so I am sure you know what I am talking about there.

What I am trying to promote is the use of Support and Resistance levels as your CORE methodology to identify levels of importance in the market and the minimal use of indicators only as a confirmation (at most, if at all) of that level.

This style of trading greatly reduces the number of trades you take and limits you to action only in certain defined high odds areas. I pay attention to fibs, pivots and Market profile numbers. However as detailed in the attachment at the start of the thread I only use thse for confluence and confirmation of the Support and Resistance numbers I watch to increase my odds further.

Thank you for your message timsk, I will try to post my numbers every morning a few hours before the NY open and am open to hearing feedback and ideas from others to improve the methodology. Over the course of the next few days I will talk about my money management style and other parts of my method.

Thanks again Timsk
 
What I would like to do in this thread is confront the compulsion newer traders have for the excessive use of indicators, using indicator as their CORE methodology. e.g. entering a trade because the MACD has crossed.
Fair play aamarx, I'm with you completely on that.
Blindly following any indicator and entering a trade because one line crosses another will almost certainly be a losing proposition in the medium to long term. Although I argue that S&R is an indicator much like any other, it does force the trader to think about supply and demand and the underlying market sentiment which is a good thing. Indicators generated by software don't force traders to think about them and therein lies the danger.
Good luck with the thread; I look forward to seeing how it develops. Oh, and welcome to T2W btw!
Tim.
 
I am a day trader, Timescales of 1day+ are not of a major concern to me as what is most important to my style of trading is what happens within that given day.

However I do like to keep an eye on what the market is up to in the bigger picture, I am sure their are many of you out there who can provide some great market commentry, please feel free to add your thoughts here.

Attached is a weekly chart from mid 2002 charting the bull market we have had for the last few years. I have marked up som Fibs, I only really pay attention to the 50% fib as it has the highest statistical significance. The 50% fib is currently at 1178 just below that level we have some MAJOR support and resistance between 1164 and 1171. This area has proven as Support and resistance over many years even going back to 2001 (not shown on the chart). I believe the confluence between the 50% fib and MAJOR S/R in this area could lead to a major bounce in the ES.

This is just my opinion, I am NOT an expert on the longer term view and so am hoping some of you other guys might have an opinion.
 

Attachments

  • 07-09-2008_Weekly.png
    07-09-2008_Weekly.png
    35.6 KB · Views: 3,541
Fair play aamarx, I'm with you completely on that.
Blindly following any indicator and entering a trade because one line crosses another will almost certainly be a losing proposition in the medium to long term. Although I argue that S&R is an indicator much like any other, it does force the trader to think about supply and demand and the underlying market sentiment which is a good thing. Indicators generated by software don't force traders to think about them and therein lies the danger.
Good luck with the thread; I look forward to seeing how it develops. Oh, and welcome to T2W btw!
Tim.

Thanks Timsk (y)

I joined a long while ago and did message a few times in my journey of "trading discovery"

I hope to shed some light on what I have learnt in that grail searching time.:cheesy:
 
Trading is about buying and selling a value, a price, a level on any given market. I've personally never bought or sold macd sep contracts, i don't think there is a market for it....is there, cbot don't list macd futs anyway.
 
Must admit that when I clicked on the attachment I expected to see a chart with sup and res lines drawn in along with pivots and fibs but no other indicators. So that was a surprise then.

Don't know if I could ever work like that but I'm open minded so please carry on aamarx.

Let's not get into the indicators work or not argument. It all comes down to if it works for you.

I personally don't see the need for indicators, but that is how I am currently trading.

Price will tell you with a certain 100% what is going on. Indicators can't be drawn until after price has declared what it is doing.
(Am I wrong in thinking that a few famous traders devised indicators after they had made an impact on the markets, in an effort to be remembered or feted). (probably).

Anyway, let's not derail the thread before its begun. aamarx believes indicators are useless. That is his view.

Carry on aamarx. Enlighten us.
 
Trading is about buying and selling a value, a price, a level on any given market. I've personally never bought or sold macd sep contracts, i don't think there is a market for it....is there, cbot don't list macd futs anyway.


Oh! Macd:rolleyes: Macdonalds! Nope, never bought the stock or futures. I had a lovely big Mac the other day though.:)
 
Let's not get into the indicators work or not argument. It all comes down to if it works for you. . . . Anyway, let's not derail the thread before its begun. aamarx believes indicators are useless. That is his view.
Carry on aamarx. Enlighten us.
Hi Options,
I had a pretty good idea where aamarx was coming from in his opening post. Nonetheless, members who aren't quite as long in the tooth as you and me might have taken his comments a little too literally and not have picked up on their intent. Far from wanting to derail the thread (never my intention), I wanted to give it greater clarity and focus. aamarx's subsequent posts have done that and, IMO, the thread now has a solid platform on which to build. Like you, I look forward to being enlightened.
;)
Tim.
 
Indicators are liars!
Indicators neither lie nor tell the truth they do what they are called and that is provide an indication

Sure sometimes you might pull of a trade or 2 but in the end you always get spanked....
This is simply not true as is evidenced by the likes of Grey1 on a consistent basis.

I believe to be an effective trader you have to look at what the majority of traders look at...So what do most traders look at? Support and Resistance! Almost every system out there uses Support and Resistance to some extent.
Please explain how support and resistance were used as a basis to trade the ES move on August 22nd ? Again not correct

Support and Resistance is our number 1 indicator. So why not make Support and Resistance your system?!
Because it frequently fails and especially so during trending markets


Paul
 
Indicators neither lie nor tell the truth they do what they are called and that is provide an indication


This is simply not true as is evidenced by the likes of Grey1 on a consistent basis.


Please explain how support and resistance were used as a basis to trade the ES move on August 22nd ? Again not correct


Because it frequently fails and especially so during trending markets


Paul


Paul,

Does Grey1 analyse volume? Off the top of my head, was he into vwaps at some stage?
 
Anyway, let's not derail the thread before its begun. aamarx believes indicators are useless. That is his view.
Thank you for your post and for the opportunity to share my thoughts. I dont think they are useless, indicators can add value if used appropriately. Let me give an analogy of my thinking towards indicators. You're about to go out to a dinner party and are getting dressed, now the CORE of your outfit, will be your suit, shirt, socks, underwear and shoes. These core elements are what make up your attire for the evening and are all pretty important for you to wear as these are the things people will look at most. As an ACCESSORY you happen to wear some cuff links, just to complete the look.

In my method I believe that Support and Resistance in confluence with pivots, MP and fibs is your CORE as these are the things people will look at most. And that Indicators should be the ACCESSORY just to "complete the look".

Now you wouldnt go to a dinner party just wearing cuff links now would you?! ;)
 
Last edited:
Anyway, let's not derail the thread before its begun. aamarx believes indicators are useless. That is his view.
Now you wouldnt go to a dinner party just wearing cuff links now would you?! ;)


Where would you wear them? I have piercings in my wrists just for cufflinks. These days it seems i'm attending more and more naked dinner parties. Always have a napkin on my lap, hot soup stings.
 
  • Like
Reactions: BSD
Indicators neither lie nor tell the truth they do what they are called and that is provide an indication


Please explain how support and resistance were used as a basis to trade the ES move on August 22nd ? Again not correct


Paul

Hi Paul

Listed below are the main numbers I would have watched that day. I say "would have" because it was my mothers birthday and I spent the day with her. I have attached a 1hr chart displaying the numbers ALL from previous time action so you cannot say I have no basis for my numbers. Please draw them on your charts and you will see that they were all pretty clear and obvious. I use 24hr globex data so be sure to use the same.

As I recall on this day we had some unexpected news at 7:41 EST about Fannie and Freddie I think or something of that nature...well anyways a major piece of news that got the market fired up.

1281.75

1283.00

1284.75

1290.50

1294.00


Best if you get up a 1 minute chart for this.

Ok so at 07:41am we had some unexpected news. That news blew though my levels at 1281.75, 1283.00 and 1284.75 If I had placed a trade at those levels I would have had gotten a butt kicking. But then again anyone in a trade then would have gotten an butt kicking because of the news.

Its now 07:43 some of the hoo haa from the news has cleared and we return to my level at 84.75, the old adage goes "past resistance becomes new support". We enter long market makes a high of 87.50 at 07:54. A move of 2.75 points A nice few points...

Price meanders around a lil and at 08:35am hits my 1283.00 level that move made a high of 87.25. a 4 point move, Hopefully by now we should have made back our money from the trades we took because of that freak news.

at 09:16 price moves back to the 84.75 area making a low of 84.25, and subsequently moves up to 85.75. only a only a point max here

Price then bombs down at the open making a low of 82.75. which get us in on the 83.00 level This up move goes all the way up to 94.00...potentially 11 points there.

At 10.09am we hit my level at 90.50 this make a short run down to 89.25 so about a point there.

The 90.50 level gets hit a 2nd time at 10:16 and gets blown out...which is a shame.

At 10:39 we hit our high of the day which is also another level of mine at 1294.00, we then move down to the low at 1283.00 another 11 point move and also my level.

Along the way at 10:55 we hit 90.50 which has become support and which make a high of 91.50 only a point there.

At 11:21 price make a move back to 90.50 which has beocme resistance, we jump in short. and ride it, max low is 83.00. So another 6.50 points max there.

At 12:06 we hit my level at 84.75 , take a lil heat but ultimately make a high at 85.75. nice 1 pointer there.

At 12:21 we hit my level at 83.00 again, this move goes all the way up to a high at 91.00. so a nice 8 points there

We hit 90.50 a couple times there for 1-2 point gains taking a max of 0.5 points heat

At 13:54 price hits at high of 91.25 our lil friend at 90.50 had to take 3 ticks of heat that move goes all the way down to 87.00 so around 4 points there.

At 14:23 we hit our old friend 90.50 he take a couple of ticks of heat but gives us a point. jolly nice fellow.

There are a couple more trades but I think I have made my point, please do check through these trades using a 1 min chart. Looked like a very profitable day to me.

All I have described here is trades using just the levels on a random day a member of the forum asked for. I have not even mentioned my set ups that get you in at a better price and improve your odds. I have not even talked about my money management method to help you minimise your risk and gain risk to reward ratios of atleast 1:2.

Everything I have described here I say with the utmost respect and not in order to put anyone down. I welcome any comments.
 

Attachments

  • 22_august.png
    22_august.png
    22.6 KB · Views: 744
Last edited:
I am not against support and resistance as I know many traders are looking at these levels,, the problem is because every one is using it so program traders KNOW these levels and data mine them ,, DUAL sided program trades ( zero profit algorithm ) create FAKE liquidity at these important levels to catch those who are waiting for the breach of these levels and trade against them ,, During the OFF LINE period ( before internet ) S/R worked differently to the way it is working Now,,
TA has evolved since the launch of internet ( even though the supply and demand is still the foundation of the market ) YOU HAVE TO EVLOVE too,,
you must have seen the film TERMINATOR.. Machine battles machine,, Intra day trading is the same battle, and is getting more sophisticated.. I think some one on this BB should take the lead and introduce the effect of program trading on IMPORTANT S/R LEVELS and HOW to trade at these levels. I don't profess expertise in this subject , but i have seen how algorithms create fake supply / demand at major S/R to get other programs traders to kick in while they trade against them ,.,

Grey1
 
Top