Indicators are liars! Support and Resistance Trading for the S&P emini

Day Trading Support and Resistance Levels 10th September 2008

Good Morning All

Todays numbers! Soz they are a bit late was managing a trade.

If you would like these via email please check out my blog at Support and Resistance Levels for the ES Trader

Always remember to use the numbers as a guideline for potential areas of high probability plays.

Always use a setup based upon your system to enter that trade

Thank you all for your support
 

Attachments

  • supportandresistancetrading.com 10-09.jpg
    supportandresistancetrading.com 10-09.jpg
    100.4 KB · Views: 398
Last edited:
Hi aamarx,
The assertion that "indicators are liars" is total rubbish. On the contrary, given that most (all?) indicators are mathematical calculations based largely on price and volume, I would assert that indicators tell the absolute truth, always, 100% of the time. There is absolutely nothing wrong with indicators. The problem(s) - when there are problem(s) - lie exclusively with the trader. The problem(s) occur because the trader . . .
1. doesn't understand fully what the indicator does.
2. doesn't understand fully how the indicator works and what its limitations are.
3. doesn't understand fully how to apply - or not apply - what s/he thinks the indicator is indicating.
The trader who does understand fully points 1 through 3 may well be able to use their chosen indicator to great effect. I would add that all three points apply to support and resistance levels just as readily as they apply to MACD, RSI, CCI or whatever. S&R levels are useless to the trader who doesn't understand what they are, when and why S&R is likely to hold or be broken and how best to apply the knowledge that they think they have about S&R.
Tim.

Indicators do not tell the absolute truth, of course. For an indicator to to do that, it needs to be invariant to the choice of units. S/R levels are real because you will see them on all time frames at exactly the same points for time frames lower than the one you are looking at. So if a support level shows on a weekly chart it will show on all time frames smaller than the weekly, and so on. The price series is fractal and S/R levels are true to price because they scale down with it. Wheras indicators such as the EMA and RSI are meaningless because they are not even a function of the price series in the strict sense.

S/R levels have the added, and significant, advantage that they give you a sensible risk control point. If one is disciplined enough to take S/R trades and let the profits run, one is as likely to make money over time as one is to get wet if you throw a bucket of water on them.
 
Hi everyone

Tomorrows numbers!

Due to some commitments tomorrow I am having to post the numbers now rather than my normal time.

If you would like these via email please check out my blog at Support and Resistance Levels for the ES Trader

Always remember to use the numbers as a guideline for potential areas of high probability plays.

Always use a setup based upon your system to enter that trade

Thank you all for your support
 

Attachments

  • supportandresistancetrading.com 11-09.jpg
    supportandresistancetrading.com 11-09.jpg
    85.6 KB · Views: 465
more info

can you please give me some more info on this system

thanks


Many traders believe that to be successful you need mountains of indicators that give you some kind of "edge" over the market. I am here to say that trading as a means of consistent income does not have to be painful or difficult. That less is certainly more when it comes to trading. Ive met traders with every indicator under the sun on their charts, with years of training under their belts having spent thousands of $$$'s and STILL not making a consistent income....

Why? Because Indicators are liars! Sure sometimes you might pull of a trade or 2 but in the end you always get spanked....Why? Because not everyone uses a MACD with your settings, not everyone uses a Stochastics or an RSI. I believe to be an effective trader you have to look at what the majority of traders look at...So what do most traders look at? Support and Resistance! Almost every system out there uses Support and Resistance to some extent. Support and Resistance is our number 1 indicator. So why not make Support and Resistance your system?! Mark up some levels on a chart using time frames from 1hr and above (this is what the big boys who move the market watch, so no lower please) and see what happens! Use other info that the majority of traders watch ONLY as confluence, Market Profile levels, Pivots and Fibs.

In the attached file is my daily worksheet, I will start posting this on the forum regularly as long as others find it of value. The levels described in the attachment are considered high probability areas for market "reversal", offering retracements of 0.75 points to in some cases 50+ points. In many instances historically referenced Support and Resistance levels can help traders catch markets tops/ bottoms to the very tick! Why? Because Support and Resistance levels are the most widely used trading tool! Everyone from Hedge funds and banks to the small time trader at home use Support and Resistance levels

It might be difficult to leave the system you are using now so why not use these levels as a guide alongside set ups defined by the system/strategy that you are implementing. All levels described have historical significance and thus considered high probability numbers. The numbers described are in a fairly large range to take account of market volatility. Throughout the trading day these numbers can become areas of Support AND Resistance.
 
One of the smartest indicators I have seen that also shows support and resistance is eminiwatch.com 's sinewave support/resistance indicator for Tradestation. When the cycle peaks (no inputs involved, i.e. same formula for any time frame), then a support line is drawn below the recent lowest low and a resistance line above the recent highest high. I turned it into a system and found it losing most of the time, which bolsters aamarxe's thesis above, however when you see these levels lining up on different time frames, which I did not test, clearly they become much more significant.

In fact, after find these indicators all lose money I developed a system that simply does the opposite, i.e. sells when the market goes up and buys when it goes down. 70% profitable over 4 years in various timeframes, but it needs optimization so I don't trust it. Still, the fact that you can get 70% indicates the value of the approach (index trading). But it is very counter-intuitive to do and when it's wrong it rides big intraday losses so not easy to trade. Many people, I think do well buying pullbacks in new trends and for those sorts of trades indicators are very helpful.

For example, if the 30 minute trend is up and the 5 minute stochastics are below 20 and the correction from the high is at least .38 percent of the previous swing low, preferably below .50 of course, then as the stochs turn up there is a high probability that the market will at least try to go up to the previous swing high before falling off. I find Keltners very helpful for this sort of thing.

But it takes patience to wait for those setups.
 
can you please give me some more info on this system

thanks


1hr chart - You draw lines at market swings and areas where price reacts.

then in the trading day you watch price action in these areas.

v simple.
 
Support and Resistance Levels 12th September 2008

Please find attached levels for today.

Always remember to use the numbers as a guideline for potential areas of high probability plays

Always use a set up based upon your system to enter a trade.

Thank you for your support.

Good trading all

Support and Resistance Levels for the ES Trader
 

Attachments

  • supportandresistancetrading.com 12-09.jpg
    supportandresistancetrading.com 12-09.jpg
    86.7 KB · Views: 416
Many traders believe that to be successful you need mountains of indicators that give you some kind of "edge" over the market. I am here to say that trading as a means of consistent income does not have to be painful or difficult. That less is certainly more when it comes to trading. Ive met traders with every indicator under the sun on their charts, with years of training under their belts having spent thousands of $$$'s and STILL not making a consistent income....

Why? Because Indicators are liars! Sure sometimes you might pull of a trade or 2 but in the end you always get spanked....Why? Because not everyone uses a MACD with your settings, not everyone uses a Stochastics or an RSI. I believe to be an effective trader you have to look at what the majority of traders look at...So what do most traders look at? Support and Resistance! Almost every system out there uses Support and Resistance to some extent. Support and Resistance is our number 1 indicator. So why not make Support and Resistance your system?! Mark up some levels on a chart using time frames from 1hr and above (this is what the big boys who move the market watch, so no lower please) and see what happens! Use other info that the majority of traders watch ONLY as confluence, Market Profile levels, Pivots and Fibs.

In the attached file is my daily worksheet, I will start posting this on the forum regularly as long as others find it of value. The levels described in the attachment are considered high probability areas for market "reversal", offering retracements of 0.75 points to in some cases 50+ points. In many instances historically referenced Support and Resistance levels can help traders catch markets tops/ bottoms to the very tick! Why? Because Support and Resistance levels are the most widely used trading tool! Everyone from Hedge funds and banks to the small time trader at home use Support and Resistance levels

It might be difficult to leave the system you are using now so why not use these levels as a guide alongside set ups defined by the system/strategy that you are implementing. All levels described have historical significance and thus considered high probability numbers. The numbers described are in a fairly large range to take account of market volatility. Throughout the trading day these numbers can become areas of Support AND Resistance.

Hello,

I've looked at the support and resistance information you provided and visited the blog site. I was not able to find any info on how to read and understand the tables, could you please provide me some direction?

Playfarmer
 
Last edited:
Hello,

I've looked at the support and resistance information you provided and visited the blog site. I was not able to find any info on how to read and understand the tables, could you please provide me some direction?

Playfarmer

Hey

I think I might make a little tutorial for everyone

The only levels that are of importance to us are in the black column S/R column. Everything else is just for confluence to help our thinking.

So when you start your trading day draw up the levels in the black column, and look for trades in that area, we had a bunch of good ones today.

Anymore questions...do let me know
 
Last edited:
Hey

I think I might make a little tutorial for everyone

The only levels that are of importance to us are in the black column S/R column. Everything else is just for confluence to help our thinking.

So when you start your trading day draw up the levels in the black column, and look for trades in that area, we had a bunch of good ones today.

Anymore questions...do let me know

I'm looking forward to your tutorial....
 
Some indicators for fun

After reading your post yesterday I threw up some SR lines and found them extremely helpful. Have used them before but got out of the habit. Thanks for the helpful suggestion. I don't exactly agree that all indicators are liars, but I do understand the thrust and indeed for some time tried to work without any at all since everything is there in the price action, obviously. Still, some indicators help shape context, i.e. range, extension, volatility etc. so they are not totally worthless.

Since this is a blog and we are sharing - and NOT to be arguing with your thread - I enclose snapshot of my ES 3 min screen. In order to make it clearer I erased the SR lines which maybe I shouldn't have done since many of them were very good today - although quite different from yours interestingly enough!

Just briefly:

The orange and blue plot dots are derived from the Sine Oscillator in Subgraph 1. This is a non-optimized (i.e. same for all timeframes) thing that shows clear cyclical versus trending periods. Not always right of course but as you can see from chart, not that bad today. The larger orange and blue dots indicate breakout of these SR levels and possible trend. Again, not always right. But these plots are drawn 'live', i.e. they don't look back to deduce the low except referencing the lowest low or high of last three bars once a cross occurs. But the bar where the dot is plotted is the bar it was deduced. As you can see, it does a pretty good job and again, in all timeframes.

The paint bars show up versus down volume. I find they are helpful with potential turning points. Along with these the Keltner bands show when market is OB/OS within usual range of oscillation. So if you get a Sine turn along with being at upper/lower Keltner and a nice volume confirmation, makes it easier to pull trigger. Actually, I use 360 tick charts for the turns if I am cycle trading, not this much slower 3 min chart which is helpful for daily picture (along with 30 min, 135, Daily etc.).

The Keltner range just shows graphically the volatility so if you are buying at lower band you can see what half the distance to upper band is instantly. Good for setting quick profits targets in cycle environment. Not predictive or anything, just statistical info. Also, since charts adjust their size according to market action to fill the screen, this one is helpful to keep things in perspective. Sometimes very narrow ranges look big on the screen or large ranges look small, so this one is just to help counterbalance that.

The Ticks show what the cash market is doing, especially extremes of buying and selling and also doldrums. The Paintbars also get thicker if the ticks are negative but the futures volume is net positive.

The magenta average is the Volume Weighted Average Price, the same in all timeframes since it's not a moving average at all. Around 10.30 you can see the market touching back to that level, a yellow paintbar near the lower keltner whilst the ticks were still negative. Around 14.45 similar setup except this time cycles due to turn as they did as high of that fairly narrow thick yellow bar taken out.

The Better Volume indicator (free from eminiwatch) is also not predictive but does show various things like strong up or down volume, climaxes, churning and so on, also helpful.

The Tick Day Direction keeps track of up and down volume and often helps keep perspective on what's happening on the day.Today it remained solidly above 0 all day long, some days it oscillates ( Trading Range days) and some days it is down below. But during an 'up' day with this 'indicator', buying pullbacks is generally safer. As you can see from this chart, most of the times the market pulled down toward the lower Keltner today except for the correction around 12.45, the market then bounced back up.

The Keltner Oscillator plotted with the Sine Wave just shows when the market is OS in uptrend or OB in downtrend, i.e. getting below the moving average that is the midline of the Keltner (which is colored according to uptrend, downtrend etc. based on crossing over hidden moving averages or can be the VWAP shown in magenta), so if the trend is up and the market goes below the midline, that indicator is just a heads up. I don't really use it actually, so probably should lift it off! When the bars are brighter colors is when it is getting interesting, is the idea.

So you can see that the indicators here, apart from the Sine Cycles SR on the main chart and in the subgraph below, just provide basic information about what's going on. I think they can be helpful in providing some perspective, but not necessarily useful in determing price points, albeit I have noticed the Keltners can work quite well in certain conditions - but then any line you draw on a chart at random will work quite well in certain conditions!

Anyway: again - really like your SR suggestion and will use it rigorously for a while, although my favorite lines are the ones that have been 'used' as both support and resistance previously, i.e. a previous top turning into a later swing low. I also find that the levels where the market broke out from a cycle low, i.e. not the exact low of the pivot but the place where it broke up are places where the market likes to retrace after the first upthrust before moving higher and these levels can often be revisited later if that initial pullback did not happen.

Thanks again.
 

Attachments

  • ES 3 min 0908.png
    ES 3 min 0908.png
    274.9 KB · Views: 517
Hi everyone

Insane day in the markets! Please be extra cautious.

Please find attached levels for today.

Always remember to use the numbers as a guideline for potential areas of high probability plays

Always use a set up based upon your system to enter a trade.

Good trading all
 

Attachments

  • supportandresistancetrading.com 15-09.jpg
    supportandresistancetrading.com 15-09.jpg
    84.9 KB · Views: 391
Hi everyone

We are all systems go for another insane day in the markets! Please be extra cautious. Attached levels for today.

Always remember to use the numbers as a guideline for potential areas of high probability plays

Always use a set up based upon your system to enter a trade.

Good trading all
 

Attachments

  • supportandresistancetrading.com 16-09.jpg
    supportandresistancetrading.com 16-09.jpg
    101.6 KB · Views: 354
Hi everyone

Attached are todays numbers

Always remember to use the numbers as a guideline for potential areas of high probability plays

Always use a set up based upon your system to enter a trade.

Good trading all
 

Attachments

  • supportandresistancetrading.com 17-09.jpg
    supportandresistancetrading.com 17-09.jpg
    85 KB · Views: 351
--------------------------------------------------------------------------------

Hi everyone

Attached are todays numbers

Always remember to use the numbers as a guideline for potential areas of high probability plays

Always use a set up based upon your system to enter a trade.

Good trading all

Support and Resistance Trading for the S&P emini
 

Attachments

  • supportandresistancetrading.com 18-09.jpg
    supportandresistancetrading.com 18-09.jpg
    91.2 KB · Views: 354
Hi everyone

Attached are todays numbers

Always remember to use the numbers as a guideline for potential areas of high probability plays

Always use a set up based upon your system to enter a trade.

Good trading all
 

Attachments

  • supportandresistancetrading.com 19-09.jpg
    supportandresistancetrading.com 19-09.jpg
    104.6 KB · Views: 361
I've got three questions. First how do you manage your trade. For example, do you set your stop loss at 6 points, your first target at 1 point and then let your second ride?

Also, do you do any premarket trading?

Lastly, would you mind sharing your trade setups?

Thanks.
 
Hi aamarx,
The assertion that "indicators are liars" is total rubbish. On the contrary, given that most (all?) indicators are mathematical calculations based largely on price and volume, I would assert that indicators tell the absolute truth, always, 100% of the time. There is absolutely nothing wrong with indicators. The problem(s) - when there are problem(s) - lie exclusively with the trader. The problem(s) occur because the trader . . .
1. doesn't understand fully what the indicator does.
2. doesn't understand fully how the indicator works and what its limitations are.
3. doesn't understand fully how to apply - or not apply - what s/he thinks the indicator is indicating.
The trader who does understand fully points 1 through 3 may well be able to use their chosen indicator to great effect. I would add that all three points apply to support and resistance levels just as readily as they apply to MACD, RSI, CCI or whatever. S&R levels are useless to the trader who doesn't understand what they are, when and why S&R is likely to hold or be broken and how best to apply the knowledge that they think they have about S&R.
Tim.

Tim,

IMO, indicators may tell the truth, but they are slow in telling it. That, to me, is just as bad, so I am inclined towards aamarx's idea. I, also, use price through averages as a signal. but those undicators underneath the chart are a dead loss, I think.

Each to his own, of course.

Split
 
I've got three questions. First how do you manage your trade. For example, do you set your stop loss at 6 points, your first target at 1 point and then let your second ride?

Also, do you do any premarket trading?

Lastly, would you mind sharing your trade setups?

Thanks.


- How I trade is pretty simple I believe

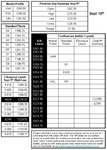
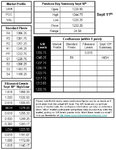
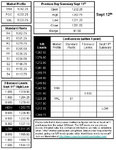
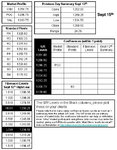
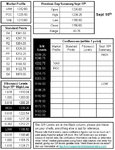
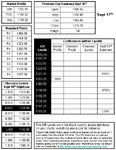
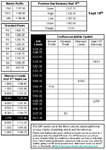
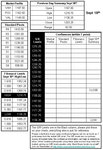
1. I use a 1hr, 4hr, and daily chart to plot my levels before the Market open. I have the levels marked up on my worksheet the one i send out for everyone.

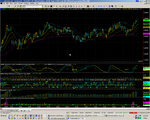
2. I use a 1 min chart for my entries, on that chart I have Bollinger bands with a 20MA and 2 Standard Deviations as the settings

3. I also have a 1 min $tick chart.

The theory behind BBs using 2 standard deviations is that 95% of price action is contained within the Bands. That 5% that moves out of the bands is at an "extreme" and that move is unlikely to be sustained. Utimately resulting in price reverting back towards the mean. (The 20MA) This is called mean reversion.

I use this and also a 1 min $TICK chart with BBs, Also looking for extremes here also.

My thread is about indicators being Liars and how people that excessively and wrongly use indicators are destined to lose. S/R is the CORE of my method. If the $TICK and the 1min BB are at extremes at these levels this is my confirmation/ set up.

I only take trades close to the S/R levels I talk about (thus limiting my trades to areas where the probability of success is high. With extremes on the BBs and the $TICK I fine tune my entry.

- I do trade the premarket pretty often

- I split my contracts into 1/3s. I have targets of 3 ticks and 5 ticks on the first 2/3s and the last 1/3 is a runner.

My stop is usually 5 ticks from entry and as soon as price moves 3 ticks my way i move my stop to 3 ticks from entry. At this point I should hopefully have 1/3 filled at 3 ticks. The next 1/3 should hopefully be filled at 5 ticks

The 1/3 filled at 5 ticks is my guaranteed profit in the trade.

The Runner exit is discretionary. It is allowed 3 ticks of space from entry before I am taken out BE on the runner(because of the initial 3tick exit). In many instances price retests a level so i like to give my trade room to breathe (only a little room mind). I like to target around 3-5 points on the runner thus keeping my risk to reward at around 1:2. So i only need to be right 50% of the time to take home a nice income.

I am very risk averse, I have toyed with all in all out but have found that this defensive management helps to keep my risk small. Many traders talk about "letting your profits run" I find that very vague and concentrate on just making a profit in any given trade that is larger than any potential loss I could have had in that trade, instead of trying to hit 50 point home runs.

I hope this makes some sense. If not I can elaborate further
 
What time frame do you draw your fibs. Do you base it off of the weekly chart or do you use the four hour chart? Also, do you draw it from a Monday low/high?

Are the pivots, daily pivots? And what is the meaning of VAH, POC, VAL. And how do those play in the confluence of a level.

As for set ups. Do you set up in areas of high confluence or will you trade an any one of the listed s/r line.

How do you use the BB's in your trading decision on the 1 minute chart.

Thanks.
 
Top