I'm having Difficulty deciphering!!

Zenda

Well-known member
Messages
491
Likes
10
Enclosed below is a chart of the Forex with the Ichimoku Kinko Hou indicator applied. Can any help me with the reading?

I used the following

Tenken-Sen = 9
Kijun - Sen = 26
Senko Span B = 52

Hope that helps - Z :cheesy:
 

Attachments

  • ichi.jpg
    ichi.jpg
    75.3 KB · Views: 715
Zenda - you're obviously as thick as the day is long lol!(only joking mate)

This happens to be my favourite indicator. No wonder you are having difficulty - your parameters are all wrong. They should be:

Tenken-Sen = pi
Kijun - Sen = (your date of birth/45.667778323457443) * your favourits Gann angle
Senko Span B = 52 - yes, that ones right.

However, as it stands the correct interpritation is as follows: if you look closely at the blue line and its relation to the red line, we can deduct that the green line gives us the indication that the blue and red shading areas are the square root of my a$$ and thus is a direct function of draw down to my account or to any other sucker who actually believes this will help their trading!

This chart says Itchi Knuts or what ever its called is an over complicated technique favoured by the japanese who seem to believe that the more complex something is the better.
 
Hey - zenda, I've never come across these indicators before. can you explain how they work. looks mighty confusing to me but I may learn something here you never know - or is this really a joke like bbb thinks
 
Its no Joke - but I havnt a clue - but its on my trading Platform!!
 
Zenda, surely the problem you are having is that you've spelt it "Sen" - I thought it was "San".

Of course, using the wrong name will apply the wrong indicator, and if you are in the northern rather than southern hemisphere, that will really screw it up.

There's no helping some people.


EDIT: Actually, "Ichimoku Kinko Hou" sounds like something you might catch from visiting a kinky girl in Thailand doesnt it??
 
Expaination

Tenken-Sen = 9 days.
Kijun - Sen = 26 days.
Senko Span B = 52 days.

The reasons the Japanese use the above numbers is because in Japan they work a six day week, so there are 26 days in their month. Makes you wonder how they fit in Football, booze and birds.

Tenken-Sen and Kijun – Sen are moving averages. These moving averages are based on the average of the days range divided by 2, as opposed to the western tendency to use the closing price.

As with conventional MA systems a crossing above or below signals an entry.

The shaded areas on your chart, the clouds, are made up from Senkou Span A and Senkou Span B.
Senkou Span A is calculated by adding adding Tenken-Sen and Kijun – Sen, then dividing by 2. You then plot this 26 days in front of the last days trading.
Senkou Span B is the highest price of the last 52 days divided by 2. This is again plotted 26 days in front of the last days trading.

The final line on your chart is the Chikou Span. This is today’s close plotted 26 days behind the latest daily closing price.

Interpretation:

1) If the days candle is above the clouds then the trend is up. The top line of the cloud acts as initial support. If broken then look to the lower line as next support. The reverse applies when the candle is below the cloud.
2) The thickness of the clouds should also be studied. The thicker the clouds the less likely we are to get a complete penetration through the cloud.
3) If Chikou Span is trading above the candle of 26 days ago, then the interpretation is that we are in a long term bullish phase. The reverse applies if Chikou Span is below the candle.


After all the above why not just use the your programme to tell you what to do. Green Cloud buy, Red cloud sell.

Your programme will wait until points one, two and three above all line up.

The system is not meant for hourly charts, more suited to daily.

I tried using this with options but for some reason I didn't persevere.

Rgds.
 
The final line on your chart is the Chikou Span. This is today’s close plotted 26 days behind the latest daily closing price.

Que??
 
do you really need all that to tell whether the long term or short term trends are up or down and if you should buy or sell

what benefit does this give you

i see bbb point now.
 
Well, it looks like a great way to justify your position when all else fails
 
I tried using this last couple of days and actually quite liked the way my charts now look. Very pretty. Only trouble is it didn't make me money...
Can somebody tell me what I am doing wrong?
 
You've gotta take the opposite position to what the chart is telling you :cheesy:
 
Dow Ichimoku

Here is a current Ichimoku chart of the Dow,does anyone have any comments on these two areas marked on the chart , the Tenkan is line turning down again in area 2.
Is the Dow taking a tumble again? or should you wait until the Tenkan Crosses the Kijun for a stronger sell ?
Red -Tenkan
Brown-Kijun
Pink-Chiko
Thanks all
 

Attachments

  • untitled7.jpg
    untitled7.jpg
    43.4 KB · Views: 275
Ichimoku update

Updated Ichimoku chart of the Dow.Any comments?
 

Attachments

  • untitled1.jpg
    untitled1.jpg
    41.1 KB · Views: 294
At risk of sounding like an arrogant know all, give some thought to whether or not you are barking in the wrong forest. Hint: trade stuff that can't be codified. Pattern and volume will tell you real time what indicators MIGHT tell you with a lag. When appropriate do what the majority who lose are not doing or the opposite of what they are doing (exceptions include going short in a strong uptrend etc). Trade people, whether it's people panicking intraday at the bottom or Walt and Irma finally putting money into a sector or country that marks the top. There are no price charts only people charts, their hope and despair and their greed and fear. Stocks don't go up they are put up. Losers react, winners anticipate and wait for early confirmation, but the people who make the big money create situations based on what they know about the way the herd behave.
 
Thanks to Marc100 - Its older than me!!

The Ichimoku chart consists of five lines and the calculation of these five lines involves only taking the midpoints of previous highs and lows, similar to the Moving Average studies. Even with its simplicity, the completed chart is able to present a clear perspective into the price action of the security at hand.
The five lines are calculated as follows:

1) Tenkan-Sen = Conversion Line = (Highest High + Lowest Low) / 2, for the past 9 periods

2) Kijun-Sen = Base Line = (Highest High + Lowest Low) / 2, for the past 26 periods

3) Chikou Span = Lagging Span = Today's closing price plotted 26 periods behind

4) Senkou Span A = Leading Span A = (Tenkan-Sen + Kijun-Sen) / 2, plotted 26 periods ahead

5) Senkou Span B = Leading Span B = (Highest High + Lowest Low) / 2, for the past 52 periods, plotted 26 periods ahead

Kumo = Cloud = area between Senkou Span A and B

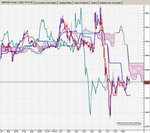
An example of an Ichimoku chart is illustrated above.


Interpretation

As can be seen from the formulas, Ichimoku is very similar to the Moving Average studies. And like moving averages, buy and sell signals are given with the crossover technique.
A bullish signal is issued when the Tenkan-Sen (green line) crosses the Kijun-Sen (purple line) from below. On the other hand, a bearish signal is issued when the Tenkan-Sen crosses the Kijun-Sen from above.

Moreover, there are, in fact, different levels of strength for the buy and sell signals of an Ichimoku chart.

First, if there was a bullish crossover signal and the crossover occurred above the Kumo (or clouds), this would be considered a very strong buy signal (indicated with three green up arrows). In contrast, if there was a bearish crossover signal and the crossover occurred below the Kumo, this would be considered a very strong sell signal (indicated with three red down arrows, as above).

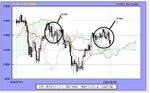
Secondly, a normal buy or sell signal would be issued if the crossover took place within the Kumo (or clouds). These signals would be indicated with two green up arrows, for a buy signal, and two red down arrows, for a sell signal.

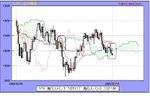
Thirdly, a weak buy signal would be issued if there was a bullish crossover that occurred below the Kumo (or clouds). This is indicated with only one green up arrow (as above). On the other hand, a weak sell signal would be issued if there was a bearish crossover that occurred above the Kumo. This is indicated with only one red down arrow.

Another striking feature of the Ichimoku charting technique is the identification of support and resistance levels. These levels can be predicted by the presence of Kumo (or clouds). The Kumo can also be used to help identify the prevailing trend of the market. If the price is above the Kumo, the prevailing trend is said to be up. And if the price is below the Kumo, the prevailing trend is said to be down.

A final feature of the Ichimoku chart is the Chikou Span (or Lagging Span). This line can be used to determine the strength of the buy or sell signal. If the Chikou Span is below the closing price for 26 periods ago and a sell signal is issued, then the strength is with sellers, otherwise it is a weak sell signal. Conversely, if there was a buy signal and the Chikou Span is above the price for 26 periods ago, then there is strength to the upside, otherwise, it can be considered a weak buy signal. This feature can also be incorporated into the other signals.


Parameters

There are three key time periods - 9, 26, and 52. When these indicators were created back in the 1930s, :p a trading week was 6 days long.
9 periods or days = one and half week

26 periods = one month

52 periods = two months

Now that the trading week is 5 days, one may want to modify the parameters to the following:

7 or 8 periods or days = one and half week

22 periods = one month

44 periods = two months
 
Top