You are using an out of date browser. It may not display this or other websites correctly.
You should upgrade or use an alternative browser.
You should upgrade or use an alternative browser.
itsourworld
Newbie
- Messages
- 4
- Likes
- 0
Trail your stop with the kijun looking 3 candles back. If it hits the kijun 3 candles back, most likely the market is going to range or reverse. Confirm the entry on a one timeframe, then trail it on the next lowest.
I mentored under the best of teachers in ichimoku, and this has always worked.
I mentored under the best of teachers in ichimoku, and this has always worked.
Went short with a trail (I never know what target I should be aiming for) on the 4hr cross, the CS has crossed price on the monthly does this indicate also bearish for sometime?
BataviaTrader
Member
- Messages
- 94
- Likes
- 5
hi all
Since about 6 months I am trying to use Ichimoku for daytrading the ES. However I have hard times determing the right timeframe to do so. As I've read in this thread, most of you guys are using Ichimoku to trade forex for swing trading. So I'm not sure I am on the right track here.
Typically I use 5min with Heikin Ashi candles, but I've been joking around with 10 and 15 min too.
Any one with a few lines ? Thanks a bunch
regards,
BT
Hello, to all!
I'm currently looking at the "Ichimoku Kinko Hyo" system and could use some friendly input! It looks a little daunting at first, so I'm wondering.
Do any of you 'experienced' guy's use this system and if so, how successfull is it....?
Where is the best place for info., on this system.
Could someone advise, please. :innocent:
shydog.
A question: is Ichimoku a leading or a lagging indicator?
A question: is Ichimoku a leading or a lagging indicator?
The Ichimoku is quite multifaceted with elements of both lagging and leading indicators. The Kumo is a leading indicator, in that it indicates future support and resistance levels. The Tenkan, Kijun are lagging indicators on the other hand and signals are generated when the two cross over either under or above the cloud, while the cloud will indicate possible retracement regions when the market is trending.
you don't have to care whether its leading or lagging. The most important thing is, do you know how to use it, and whether you have your money management in place.A question: is Ichimoku a leading or a lagging indicator?
hi all
Since about 6 months I am trying to use Ichimoku for daytrading the ES.
BT
Have you ever made money day trading the ES? I found that very difficult and gave up.
BataviaTrader
Member
- Messages
- 94
- Likes
- 5
Have you ever made money day trading the ES? I found that very difficult and gave up.
In fact, I am still trying to as we speak 🙂. It's something I really want. Right now I am trying to develop an automated system, because the whole fear and greed concept has been bugging me for such a long time.
BataviaTrader
Member
- Messages
- 94
- Likes
- 5
ES strong support from 1626-28 area
BataviaTrader
Member
- Messages
- 94
- Likes
- 5
ES heavy support at 1626-28 area


BataviaTrader
Member
- Messages
- 94
- Likes
- 5
figuring out how to attach pics. any suggestions for a good uploader?
BataviaTrader
Member
- Messages
- 94
- Likes
- 5

Hi friends,
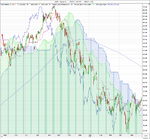
could you please provide your analysis comments on the above chart?
I found it bearish and right time to short; your views please.
I would not go short yet:
1. The (future) Kumo is still bullish as far as I can see on your chart.
2. Although the Chikou Span is below the price from 26 periods ago, it it still above Kijun Sen. It could turn and break upwards through price again.
3. Look at the trend lines I draw. Price just bounced upwards from the lower trend line (support).
I would wait until price closed below this lower trend line and place a sell-limit to play the retracement.
BT

Similar threads
- Replies
- 3
- Views
- 4K
M
- Replies
- 2
- Views
- 7K
- Replies
- 69
- Views
- 16K

