Well (you may recall in an earlier post on this thread) according to the Gabor method, if we add yesterdays high and low then divide by 2 the midpoint for today is 1.3595 and if it goes up/down this price take the trade, so we should now be long by her reckoning, interesting!!! Backtest anyone?
You are using an out of date browser. It may not display this or other websites correctly.
You should upgrade or use an alternative browser.
You should upgrade or use an alternative browser.
lol, s/l to breakeven.
s/l hit
re-entry round number .3600 s/l .3550
isatrader
Senior member
- Messages
- 2,965
- Likes
- 136
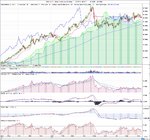
I've exited my silver trades this morning as the price closed back below the Kijun line after making a lower high the week before. Momentum is weak and the short term daily channel has been breached to the down side, so I've taken my small profits, which have mainly come from the move in the GBP/USD and stepped aside for a bit as I think there's a chance of a move back to the cloud support and possibly lower in the short term. I'll be looking to get back in once I think the move has played out.
Attached is my chart
Attached is my chart
Attachments
isatrader
Senior member
- Messages
- 2,965
- Likes
- 136
Isatrader,
Well done. Make sure you tell us prior/when you are next a buyer and we can follow your logic. I'm still on my vegas buy (moved s/l..tut tut)
How long have you used Ichi?
T
I did post my final entry of my silver trades a few days after on page 5 of this thread. See http://www.trade2win.com/boards/indicators/117548-ichimoku-5.html#post1662620 which was when the price retested the Kijun line after breaking out of the cloud and broke back above it which is my favoured entry point. As the momentum has been weak and price has again closed below the Kijun line - which has stayed flat. I'm thinking it's not ready yet to retest $50 and instead might be more likely for a retest of $32 area.
I've used ichi for a few years, but my time frames are mostly daily and weekly as I like to use it to try and get in near the start of a new trend and hold the position for a while. I use it in combination with my other favoured methods which are Stan Weinstein's stage analysis and Point & Figure charting.
isatrader
Senior member
- Messages
- 2,965
- Likes
- 136
Are you looking at anything else as a potential, btw I'm ok with daytrading, I really want to get ichi understood if I can, it really is good if one can ask why someone is taking a trade and the logic behind it.
Nope, is nothing else on my radar at the moment. I'm 2/3rds in cash again now and am going to watch for a little while from the side lines and see if the market can base. One of the lessons I've learnt over the years is there's nothing wrong with stepping aside and protecting your account when you are long term trading. Day trading is a different ball game so I can't offer you much help there I'm afraid, but I imagine the method is the same, but that you have to be a lot quicker.
isatrader
Senior member
- Messages
- 2,965
- Likes
- 136
Isatrader
So. when you trade the daily timeframe and/or weekly do you use a s/l? I'm curious how wide!!
I do use a hard stop loss sometimes on stocks, but when I'm trading etfs like I do with silver I don't as spreads can be widened by the market makers which would stop you out for a big loss even when you are in profit, so I use a mental stop loss which is a close below the Kijun line, a break below a channel, or a point and figure sell signal.
I buy between £1000 and £3000 worth of shares per trade so I would usually exit if I've lost around 20% and the charts still look like going down. So my stop loss amount is between £200 and £600 depending on the amount of shares bought.
isatrader
Senior member
- Messages
- 2,965
- Likes
- 136
I could'nt cope with the stress lol it would give me an ulcer ...👍
It's a lot easier to handle larger amounts when you are trading with no leverage and understand the average true range of the particular product and how it moves on a daily, weekly and historical basis. This means that when I get moves outside the normal range that I become more cautious.
rathcoole_exile
Guest Author
- Messages
- 3,925
- Likes
- 767
Ok, what I mean is, you went in at 1.3590 with SL of 1.3700 yesterday. And the price does go to 1.35 level (around there) during one period.. so I was wondering, did you move your trailing stop manually ( ie , you ensure your profit). I am guessing no, because you got stopped out (which i assume it touches 1.3700 some time after it went to 1.35 )? So I am just suggesting you include an automatic trailing stop ( if you don't have the time to monitor the screens ) just so that you can lock in your profit.
I think its a pity because you could have gotten some good pips yesterday 🙁
i got stoppedout at 1.3670, which was where Kijun was on the 1H when price closed above it
price is now in the 1H Kumo cloud, so I'll be looking for a breakdown thereof to go short again..if it happens
ok, i thought you had stopped out at 1.3700 (your initial SL position ) 🙂i got stoppedout at 1.3670, which was where Kijun was on the 1H when price closed above it
price is now in the 1H Kumo cloud, so I'll be looking for a breakdown thereof to go short again..if it happens
We have a long legged doji candle on the daily timeframe, still forming until a new daily candle arrives, not long now. It is too early yet, I think to take shorts/longs. Having said that I am still attached to my long. If 'Jahdave' is anything to go by I do not know, but apparently he is rarely wrong heh heh.............
rathcoole_exile
Guest Author
- Messages
- 3,925
- Likes
- 767
rathcoole_exile
Guest Author
- Messages
- 3,925
- Likes
- 767
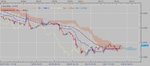
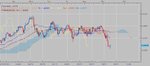
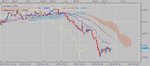
We need to understand the daily or we are lost.
nothing Bullish about Daily or 4H....
Attachments
Similar threads
- Replies
- 3
- Views
- 4K
M
- Replies
- 2
- Views
- 7K
- Replies
- 69
- Views
- 17K