You are using an out of date browser. It may not display this or other websites correctly.
You should upgrade or use an alternative browser.
You should upgrade or use an alternative browser.
isatrader
Senior member
- Messages
- 2,965
- Likes
- 136
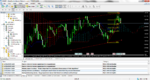
What does your point and figure chart show for eur/usd?
The P&F charts are bearish. I've included below the traditional chart and some variations in box sizes to show the different price objectives which range between 1.24 to 1.3375. I've also included my custom P&F chart which uses point and figure data in combination with Keltner channels with 3 ATR levels to identify channel support levels and targets.
My custom P&F charts moving averages are closing to crossing to the downside. Price has rebounded at the -1ATR level and is moving back towards the breakdown resistance zone between 1.39 to 1.41 and finally the RSI has broken the -10 zone which normally signals the beginning of a new trend.
So from this my medium term outlook is bearish, but very short term it is back up to the resistance zone above 1.39 before it gets sold down again IMO. But that's just based on my interpretation of the P&F charts. I don't trade currencies myself.
Apologies, this is a bit off topic in the ichimoku thread.
Attachments
Last edited:
Isatrader
Many thanks, very much as r-e was saying. I think it helps me with Ichi, for example we have CS cross bearish, blue cloud on the daily/wkly in the future and a good match for the .3900 areas eventually, but we are still bearish on the 4hr with a red cloud with more downside to come within a slightly upside channel on the 1/4hr timeframes thats good to trade off.
What I find great with Ichi is you actually get the signal when to enter and when not to trade (great if you overtrade) in spite of other indicators, the clouds sit right on the fibs, it has been created with time and price along/before with Gann, amazing indicator especially when considering the era it was created, I have so much respect for it.
Well, a very nice rally, with bearish gartleys now appearing on the 4hr / 1hr. Targets at least .3645 and more at .3509 very tricky though given Ichi looks still bullish and heading for .4021 kijun-sen on the daily and the chiukou span passing through price on the 4hr!!
rathcoole_exile
Guest Author
- Messages
- 3,925
- Likes
- 767
just closed my eur/jpy short, that had been on since 30/8, as it's closed above the 4H Kijun
:-(
:-(
rathcoole_exile
Guest Author
- Messages
- 3,925
- Likes
- 767
i believe the general principle is to stay out of any new trade whenever the T or K go flat
rathcoole_exile
Guest Author
- Messages
- 3,925
- Likes
- 767
any break below 1.3760 and I reckon we're in Shortsville again ..... (1H)
isatrader
Senior member
- Messages
- 2,965
- Likes
- 136
US Dollar Breakout above cloud
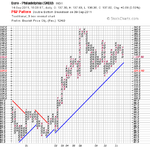
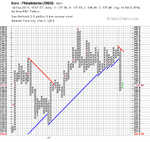
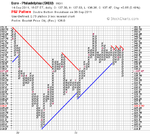
I mentioned this in my stage analysis thread as I got a buy signal for the US Dollar Index with Stan Weinstein's breakout method. So I thought I'd have a look at Ichimoku as well for additional confirmation and it looks like the Chikou Span has had a good breakout from the cloud for the first time in a year in the last few weeks and price has made it back to the 200 day moving average. Thoughts?
I mentioned this in my stage analysis thread as I got a buy signal for the US Dollar Index with Stan Weinstein's breakout method. So I thought I'd have a look at Ichimoku as well for additional confirmation and it looks like the Chikou Span has had a good breakout from the cloud for the first time in a year in the last few weeks and price has made it back to the 200 day moving average. Thoughts?
Attachments
Well I have just taken another sell signal of the 5m t/f when everything lined up, great trade. I have been running ichi now for a few weeks and watching how it performs alongside my dynamic fibs and harmonic patterns and macd, there is no comparison for ichi, albeit I stand to be corrected.
It would be good if other ichi traders tell us how they trade it, but for me so far, if your two higher timeframes are under the cloud all you do is wait for your entry signal and jump in, my entry signals are either 5m or the 15m respectively.
Also if other traders see a potential ichi setup on the horizon why not tell other ichi traders here, I only trade the eur/usd, but other traders do not restrict themselves to just one currency pair.
rathcoole_exile
Guest Author
- Messages
- 3,925
- Likes
- 767
i've got my forex ones trading automatically, so its hard to call real time as i might be out or in bed etc
(the current one I'm in is a beaut - check out the NZDUSD short from .8200 🙂 )
but if I get chance, I'll post my live trades on ES, oil and gold if any occur
(the current one I'm in is a beaut - check out the NZDUSD short from .8200 🙂 )
but if I get chance, I'll post my live trades on ES, oil and gold if any occur
r-e
That would be great and thank you for your help it is very appreciated. Fantastic short, wow. What parameters are used in your auto/ or in some cases personal reasons for entering.
My eur/usd stop loss is at .3466 to protect profits on the 1m cloud, my thinking is that if price breaks/closes above this 'thin' cloud then on the 5m t/f there appears to be nothing to block price going up to that cloud on the 5m t/f and of course a possible re-entry, I do not know if I am correct here and would appreciate your comments as to this way thinking?
rathcoole_exile
Guest Author
- Messages
- 3,925
- Likes
- 767
i can see where your .3466 comes from, and it's as sensible place as any on that 1m TF
personally, i think the noise on 1m is too high, so I would be inclined to use 5m for my SL
in this case, i would be inclined to move my SL to a close above the 5m Kijun, and keep moving it lower, tracking the Kijun as price continues to fall
It just happens that the 5m Kijun at the moment is at exactly .3466 🙂
same result, just a different approach .......
I suppose it would be a waste of time to try to exhort you to consider trading higher TFs instead of these noisy little ones ?
rathcoole_exile
Guest Author
- Messages
- 3,925
- Likes
- 767
wel that didn't take long
if i had been trading your TF, I would be out at .3460
after price closed above Kijun on 5m,
looking for a possible re-entry
but in the H1, I'd only be getting concerned if price closes above previous H1 candle at .3478
if i had been trading your TF, I would be out at .3460
after price closed above Kijun on 5m,
looking for a possible re-entry
but in the H1, I'd only be getting concerned if price closes above previous H1 candle at .3478
r-e
I would trade the higher timeframes if I knew what I was doing. Being new to Ichi I thought I would adopt this way of trading it until I get used to it. If you would be willing to show a trade before you enter with the what, why and when example to help me and other traders to understand the best way to trade ichi that would be fantastic.
At the moment the way I am trading it as described has given me a few hundred pips, which is great, but personally I do think the higher timeframes are better and I think with ichi one could achieve a great deal more and I know on these smaller timeframes I have missed out on some great moves and got left behind lol.
Similar threads
- Replies
- 3
- Views
- 4K
M
- Replies
- 2
- Views
- 7K
- Replies
- 69
- Views
- 17K