Best Thread How To Make Money Trading The Markets.

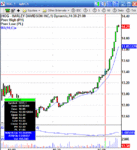
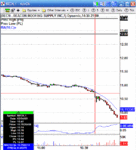
Here's one from this afternoon.
+$860 for a 1000 shares and obviously pro rata for different numbers of shares.
As usual, red X hairs on the entry and image taken at time of exit.
I didn't wait for the usual chart exit signal (discussed several times) as my micro-analysis of level 2 T&S suggested imminent instability.
Richard
 

Attachments

  • 030209HOG.GIF
    030209HOG.GIF
    26.4 KB · Views: 438
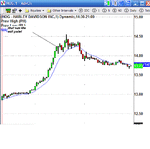
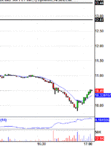
Here's a chart of what happened later. You can see how instability appeared on the exit candle seconds shortly after my exit. Following that it became extremely unstable, then fell. Reading the behaviour on micro-analysis (beyond the scope of this thread) warned me in advance of what might happen before it did so.
This behaviour is quite frequent as price approaches its high in an up move or its low in a down move. It's not certain, nothing in trading is, but the probability is high enough to provide a major edge.
Richard
 

Attachments

  • 030209HOGwhathappenedlater.GIF
    030209HOGwhathappenedlater.GIF
    17.1 KB · Views: 348
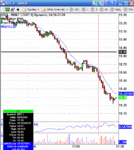
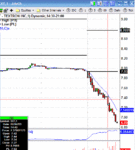
Here's another one I've just traded.
Chart exit as the high took out the high of the previous candle
+29c per share on this one
Richard

PS Of course some of these do fail, but not often, and your risk is very clearly defined.
 

Attachments

  • 030209BBT.GIF
    030209BBT.GIF
    27.6 KB · Views: 375
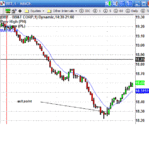
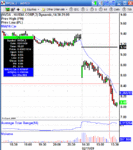
And this is what happened later.
Take what the market offers with clearly defined rules.
Don't wish, hope,fear etc. - trade on the evidence
Richard
 

Attachments

  • 030209BBTwhathappenedlater.GIF
    030209BBTwhathappenedlater.GIF
    19.1 KB · Views: 321
The risk was a break of the entry candle high. That's 6c.
Reward unpredictable, but no support down to the deep blue sea.
Richard
 
I exited before the chart signal of the previous high being taken out because micro-analysis of level 2 and T&S showed a possible reversal was coming.
Richard
 
I've just looked at it again and the reversal actually came on the same 1 min candle when I covered and I caught the actual precise low.
As I said yesterday, it doesn't always work out like that, sometimes you can end up getting out too early - but all you can do is to trade on the evidence in front of your eyes.
Here's what happened.
Richard
 

Attachments

  • 040209BECNwhathappenedlater.GIF
    040209BECNwhathappenedlater.GIF
    8.9 KB · Views: 315
Great stuff Richard.

Once again simple strategies trading in the direction of a strong trend, easy when you stick to the rules!!!

Funnily enough the two trades i made money on today were ones like these, taking out lows. The others where i tried to be clever and catch a reversal ended up catching me out!

Keep up the good work.
 
good stuff Mr Charts
I made a few trades today following this system, ( i think)
Beacon Roofing for 40c (in later than Mr Charts)
SLM for 35c (should have got more)
TXT for 30c.
I tend to scale out too early
I don't know how you post charts on here, or indeed if one should, as it is Mr charts thread?
 
Well done notlob - that makes me feel my posts are worthwhile :)
Could you please not post charts here as I think it is better for readers not to get confused.
Perhaps start another thread, like megamuel.
Thanks,
Richard
 
Actually, notlob, I also traded TXT using a different one of my set ups and grabbed an image for my private bulletin board (this is not an advert, mods, it's invitation only for my group).
I'll post it later.
Richard
 
This is NOT a trade using the set up discussed in this thread, but I used another of my methods and I'm only including it as I think notlob might be curious and it's a co-incidence (or maybe he and I found the opportunity in a similar way) that I happened to grab the image at exit for other people.
Richard
 

Attachments

  • 040209TXT.GIF
    040209TXT.GIF
    21.1 KB · Views: 392
thank you very much for your replies, Mr Charts.

Regarding TXT, it came through on my news monitor shortly before the market opened, i put it on my watch list and traded it accordingly.
It is encouraging, for me, that I entered on exactly the same bar as yourself, even if I did not let all of it run as long as I should have done.
I know this thread is just for the one method, but, yes, I am a curious and interested to know how TXT came into your list?
thank-you once more for this most interesting thread.
 
Here's another; this is slightly different because there wasn't a clean downtrend before the entry. Nevertheless it looked very highly probable from micro-analysis that it would fall so that triggered my short.
Even without the benefits of understanding level 2 T&S the maximum loss for a pure chart trader was the high of the candle 10c away. Clearly defined risk.
Entry on the red X hairs, exit at time of screenshot.
Exit as per the normal chart rule mentioned many times.
A nice gentle swing trade for +35c per share.
Richard
 

Attachments

  • 110209NVDA.GIF
    110209NVDA.GIF
    29.6 KB · Views: 372
OK, cool, wasn't sure if you meant that or some sort of dig at MR CHARTS as he does have his private forum.

(was going to be rather blunt if it'd been about the latter!)
 
Hi Mr Charts, how important is the level 2 time and sales in intraday nasdaq strategies? The chart patterns are very good, but its just that I have tried looking at nasdaq level 2 and TS before and it seemed way too fast and difficult to see what was going on. Do you think it could be possible to trade the chart patterns only and make a profit? Thanks
 
Top