avtardhillon
Junior member
- Messages
- 36
- Likes
- 0
when i trade i tend to buy late or sell late when a trend is over ?
Last edited:
when i trade i tend to buy late or sell late when a trend is over ?
Or maybe you didn't buy late and sell late. They saw you coming and thought your money could be used for buying lunch. So they took it from you.
from your post i don't lnow if it was a joke or not but i can sa no i didn't sell or buy anything during lunch i am talking about what systems or methods are used to predict a trend
Identify a trend, or predict a trend?
Identifying a trend is quite straight forward..prediction is something else entirely
yep that is what i mean
good glad thats sorted then
Hi avtardhillon,when i trade i tend to buy late or sell late when a trend is over ?

Hi avtardhillon,
Take a look at this Sticky - plenty of links to help you: Essentials Of Technical Analysis
Also, there are lots of contributions in the Articles section of the site - of which this is one: Capturing Trend Days
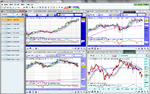
You have to define a trend so that you can look at any chart and say whether it's trending up, down or sideways. How you do that is up to you. Typically, many traders look for a one or more higher highs and at least two higher lows in an uptrend. Visa versa for a down trend. Alternatively, you could use moving averages or, if you're really lazy and want everything handed to you on a plate - use Point & Figure charts. Most software packages these days will draw trendlines on a chart for you. Here's an example . . .
View attachment 152496
Each X and O represents a move of 50 points on the Dow. The trend remains bullish until the blue line is broken.
HTH.
Tim.
Hi avtardhillon,
Take a look at this Sticky - plenty of links to help you: Essentials Of Technical Analysis
Also, there are lots of contributions in the Articles section of the site - of which this is one: Capturing Trend Days
You have to define a trend so that you can look at any chart and say whether it's trending up, down or sideways. How you do that is up to you. Typically, many traders look for a one or more higher highs and at least two higher lows in an uptrend. Visa versa for a down trend. Alternatively, you could use moving averages or, if you're really lazy and want everything handed to you on a plate - use Point & Figure charts. Most software packages these days will draw trendlines on a chart for you. Here's an example . . .
View attachment 152496
Each X and O represents a move of 50 points on the Dow. The trend remains bullish until the blue line is broken.
HTH.
Tim.
just read the post thanks on the thread about TA
when i trade i tend to buy late or sell late when a trend is over ?
Trend trading is easy , difficult part is finding real trends.
You see trends where none exist
http://www.trade2win.com/boards/trading-psychology/162984-self-fullfilling-prophecy-set-ups.html
Some types of trend trading has high failure rates , so traders have to be highly experienced to trade trends.
http://www.trade2win.com/boards/forex/162398-box-breakout-trading.html#post2021234
The famous turtle failed on live accounts
Dennis managed pools of capital for others in the markets for a while, but withdrew from such management in the spring of 1988 after his clients suffered heavy losses.
Richard Dennis - Wikipedia, the free encyclopedia
Henry to Exit Money Game
John W. Henry to Stop Managing Client Money - WSJ.com
great charts chattiFX, look closely and you will see the basis of "trend signal" a 3 grand advisory signal systen
The famous turtle failed on live accounts
Dennis managed pools of capital for others in the markets for a while, but withdrew from such management in the spring of 1988 after his clients suffered heavy losses.
when i trade i tend to buy late or sell late when a trend is over ?