bnaimy
Established member
- Messages
- 812
- Likes
- 55
And also 2 silver awards for the second best valuable contributer and favourite journal. That makes Bashir the best allround winner :cheesy:
Congratulations too!
Thanks 🙂
Bashir N
And also 2 silver awards for the second best valuable contributer and favourite journal. That makes Bashir the best allround winner :cheesy:
Congratulations too!
Hey everyone, sorry for being missing in action.Been very busy lately and haven had the time to be that active as i used to be.
I have been doing something very interesting that i think some of you might like.
I was sitting there thinking that many times the orginal method was very difficutlt to follow and that its difficult to look at 5 charts and get a picture.
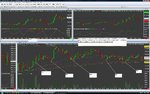
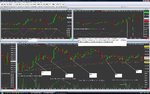
So i have made a compact version of it, and it only uses 3 chart and 90% of the moving averages are on the 1 chart. SO you can get the entire picture from all the timeframes on 1 chart and use the 2 others to find the direction and the finetuned entry.
Its also a little improvment to it, so rules will be around the same.
But i recommend everyone that wants to learn it the right way, and those things that cant be explained to visit use at the chat room where we are doingt the trades and the you will get a better sense of how it all works.
I will post the chartbook templete here for those who use sierracharts and i will also post the spesifict for those who dont have the sierracharts.
I am also working on getting all the stochastics on 1 chart, i am waiting for reply from the sierrasupport on how to do that.
Ill have it out later today.
And the automated system is still not forgotten btw, i am still talking with Vigi about how we a can take everything we have learned so far and use it for something usefull.
I think making it fully automated is not the way to go, i think we will make it a system that will tell you when all the rules are in the green, so then you can enter the trade at the perfect place. THis will work much better. The more i look at it the more i am convinced that fully automation just does not work in the long term, there is nothing that can replace the wonderfull thing we call the brain 😉
And i will make this indictor for the manual method, so that when all the rules are OK, it will alert you and you can get busy with taking the trade.
Cya all soon.
With kind regards
Bashir Naimy
Regards
Bashir N
Bnaimy and everybody how are you ? I want to ask you if my settings are ok , I´m using in YM in 1 minute chart ADX , Williams , MACD , 16 SMA with 16 EMA it seems fine but i´m paper trade now . Do you think the Slow Schos is better than ADX and Williams? Do you think is good to trade in 1 minute only what am i missing ? What do you recommend Thank You
Luis
It's for all these reasons that you have won this forums highest accolade Bashir. Congratulations mate, I dare say that there are a good few traders walking around with heavier pockets thanks to your good nature (I'm one of them). As Willem said, very well deserved...
All the best,
Stuart
Hi Bashir i will check out your settings !! Do you still have the same settings , as Feb 21 of 2009 ? Do you have another video of you doing samples ? All the best
Luis
Hi Bashir really thank you for answer ok , Can you trade the new method that you have in YM ? Or is just for NQ ? Thanks
Luis
Bashir and if you trade YM what are the settings . Hopefully all we can help each other .
Luis
Hi Bashir can you explain how do you use the new method in some words and you use it in NQ and YM ? Thank You
Luis
I have added a templete and a screenshot of the charting setup, and i would like to get some feedback to why i have noted where to buy and i want you all to tell me why i buy there? I want to see that you guys can see what i see on those charts.
With kind regards
Bashir Naimy