M
malaguti
Hi celeron,
Can i ask you how long time you've spent on studying Gann theory?
Tks
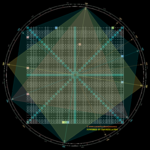
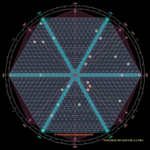
And if I could also ask Celeron, what software package do you use? great looking charts, and have been looking for a good gann tool for sometime now