Fxcorrelator_goldmeter

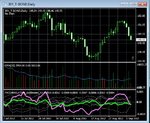
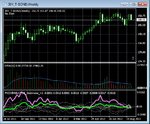
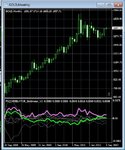
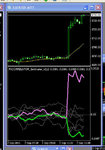
Here are a daily and weekly charts for 30Y T-Bonds in case anyone has them (can also be traded on the stock market via the ETFs long=TLT, 2x short=TBT)

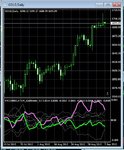
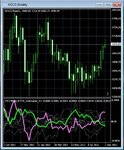
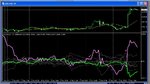
The violet line representing the Bonds is crossing both the USD line and the 0 level in the 2 charts, this looks to me to be a very long term down signal.
At the same time, in the daily chart we see that volume is growing (green bars) together with the falling candlesticks of the price, especially during the last few days, which also implies that there is conviction in the down trend.

Personally, I have bought the TBT ETF and it's also possible to buy a put option on TLT (with expiration at least in January '13, or even longer term ones with expirations in 2013 or 2014), or if your forex broker has it - just short it with proper money management - i.e. sell just a little and wait for weeks and months at least. In any case it's very important not to bet the house on it because there may be upswings with drawdowns so you'll sleep better at night and also nothing is 100% guaranteed.

Noam
 

Attachments

  • Bonds Daily.jpg
    Bonds Daily.jpg
    129.3 KB · Views: 347
  • Bonds Weekly.jpg
    Bonds Weekly.jpg
    129.1 KB · Views: 393
Hey N

apologies but I am not convinced (as yet) that this is entirely suitable for bonds......can you outline here what Bond prices mean and how you are applying the indicator principles please ?

Thanks (y)
N
 
Hey N

apologies but I am not convinced (as yet) that this is entirely suitable for bonds......can you outline here what Bond prices mean and how you are applying the indicator principles please ?

Thanks (y)
N

The Bond prices are the price of a 30 year treasury bond (issued by the US government) (a CFD in forex). Those prices go in an opposite direction to the yields. The yields on US and some other countries' bonds have been trading recently at all time lows, and they can only go so far down because if their yield is negative then people won't want to hold them otherwise they'd be paying interest to the government just for having lent money whose principle will be returned after 30 years. So, yields have a lot of room to go up in the coming years, while the bond prices, which are at historic highs have a lot of room to go down. If I'm right, TBT has the potential to profit for years like a savings account only the gains will be far higher. (when bond prices go down then TBT goes up 2x as much in percentage terms).

About the suitability of the indicator, if you look back in time you'll see that there's a pretty good correlation between the two, even though sometimes there are a few whipsaws and slight lags. It catches most big trends, and also the underlying principle should apply to bonds just like in gold.
Also, I've heard from other sources that this should be a good idea (to short bond prices).
 
yep - thats fine ....and I agree with many of your comments

but why is it a good idea to use this style of indicator and price it against the relative price of the G8 currencies as a signal ?

Gold is a Currency...........a bond is not ?

N
 
i'd recommend an indicator that put 30 year TBonds alongside some other Global bonds + some Equities and perhaps commodities........

Forex lines is probably not the best partner in this case ?

N
 
Yesterday was a good day for falling bond prices, the interest rate for 10 year bonds went up 1.59 to 1.67, while TBT went up by 3.2%.
The closing number for the interest rate 1.67, is 1.67% interest payed per year on the 10 year bond (close by to 30 year bonds, too).
Imagine, this rate went yesterday from 1.59% to 1.67% - historically such rates can go above 10% (on Sep 1981 it was 15.84%) all the while, for this 0.08 change in the rate, TBT went up by over 3%.
 
i'd recommend an indicator that put 30 year TBonds alongside some other Global bonds + some Equities and perhaps commodities........

Forex lines is probably not the best partner in this case ?

N

Maybe you're right, even though the USD is the key to everything, sometimes the correlation changes, even the correlation between the USD and gold isn't alway the same.

However, you can determine if there is a regular or inverse correlation at any time by looking at the recent price history. Such reversals in correlation aren't frequent, and you can trade the indicator whether the correlation is with the USD or inverse to it just by reversing the interpretation of the buy and sell signals. And I think that as long as there is any correlation the signals will be mostly right.

If you prefer to stick with forex pairs and gold, though, I understand and will do so.
 
Hey Nlenz

Ok- interesting comments !

lets stay on Gold for this thread as thats the title here - very happy to have you helping and posting and keeping it moving........

I dont trade bonds and dont even have them on my brokers charts

Suggest you start a new thread in the bonds forum and discuss Bonds there as a specialised style

happy to have you utilising my indicator(s) if they help !

N
 
yep - thats fine ....and I agree with many of your comments

but why is it a good idea to use this style of indicator and price it against the relative price of the G8 currencies as a signal ?

Gold is a Currency...........a bond is not ?

N

I think the USD is the key, and has the most influence of all the currencies.
As to why the signals are valid - there isn't necessarily a fundamental reason, and they may not be directly related, however there are patterns that often occur while the currencies may be viewed as a background or ruler against which other instruments move, much like a graphing paper, in my opinion.
Even only looking at the 0 level you may be able to determine the bond signals like with an oscillator, violet (bonds) crossing up = buy signal and v.v. because after all, this is a sort of moving average like the MACD, only with the extra correlation to the currencies.
 
Hey Nlenz

Ok- interesting comments !

lets stay on Gold for this thread as thats the title here - very happy to have you helping and posting and keeping it moving........

I dont trade bonds and dont even have them on my brokers charts

Suggest you start a new thread in the bonds forum and discuss Bonds there as a specialised style

happy to have you utilising my indicator(s) if they help !

N

Sure thing NVP, will do.
 
Here is Gold on 3 timeframes: Daily, Weekly, and Monthly.
Since in all of them the violet line (Gold) is above the green line (USD) and as an added bonus also above the 0 line (when viewed as an oscillator), it looks to me that the long term trend is up.
And that this should be in our mind when considering trades in lower TFs.
 

Attachments

  • Gold Daily.jpg
    Gold Daily.jpg
    137 KB · Views: 348
  • Gold Weekly.jpg
    Gold Weekly.jpg
    143.5 KB · Views: 327
  • Gold Monthly.jpg
    Gold Monthly.jpg
    128 KB · Views: 345
Damn, I didn't think I'd be wrong about bonds this fast! :-0

"It's tough to make predictions, especially about the future."
Yogi Berra
 
did anyone get the gold move ?
 

Attachments

  • gold spike.jpg
    gold spike.jpg
    32.4 KB · Views: 512
Here is Gold on 3 timeframes: Daily, Weekly, and Monthly.
Since in all of them the violet line (Gold) is above the green line (USD) and as an added bonus also above the 0 line (when viewed as an oscillator), it looks to me that the long term trend is up.
And that this should be in our mind when considering trades in lower TFs.

no argument there............most senior forecasters and traders have gold on the buy/watch list

golds should be a 1 way street North ..but markets are never predictable ;)

N
 
Damn, I didn't think I'd be wrong about bonds this fast! :-0

"It's tough to make predictions, especially about the future."
Yogi Berra

dont beat yourself up N ..........get that Bond Thread up and running and I guarantee this will add to your learning process..like journals do (y)

N
 
no argument there............most senior forecasters and traders have gold on the buy/watch list

golds should be a 1 way street North ..but markets are never predictable ;)

N

Thanks. It's true there is no predictability.
 
dont beat yourself up N ..........get that Bond Thread up and running and I guarantee this will add to your learning process..like journals do (y)

N

O.K. Thank you for the suggestion.
 
GOLD WEEK – Results|FXCORRELATOR[/url]

hey all

well heres the first week for you guys using my Free goldmeter

early week was slow .....then action on thursday and friday !

I was nervous of thursdays sell signal because the Green USD was not aggressively rising

and I need that to confidently trade XAU/USD - (naturally)

my loss !..a big move !

Friday was fast but a peach move

have a good weekend

N
 

Attachments

  • Goldweek.jpg
    Goldweek.jpg
    96.1 KB · Views: 361
Last edited by a moderator:
Top