You are using an out of date browser. It may not display this or other websites correctly.
You should upgrade or use an alternative browser.
You should upgrade or use an alternative browser.
Vodafone performance
For FTSE100 bulls, Vodafone recent performance is not encouraging having broken through the 124p support area.
It accounts for approx 7.8% of the FTSE100.
Note on the weekly chart how the support trendline became the resistance line
For FTSE100 bulls, Vodafone recent performance is not encouraging having broken through the 124p support area.
It accounts for approx 7.8% of the FTSE100.
Note on the weekly chart how the support trendline became the resistance line
Attachments

barjon
Legendary member
- Messages
- 10,752
- Likes
- 1,863
Mully
Don't remind me!! I've been obdurately hanging on to Vodaphone in my investment portfolio since 140 (no, not the last time but the time before that 😱 ) and didn't even have wit to break even when it bumped its head there and retreated. Talk about money tied up to no good purpose, ignoring all the ta signals and trading rules - well, it is my investment portfolio so it doesn't count 🙄
Good trading
Jon
trade-at-will
Newbie
- Messages
- 6
- Likes
- 0
Hi All,
I've just found t2W, I've been trading for many years, mainly in a busy dealing room, but for the past few years I've been stuck out in the middle of no where and am missing other peoples' views, input etc
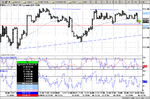
Ftse Sep seems to be stuck in a sideways channel, with prices currently just off the horizontal support level @4485, but a move up through 4525 would look encouraging. For the moment I'm trading the range, buying 4490's, with stops below 4480's, with a target of 4520+. I'd be interested in any of your views for the short term
TaW
PS how do you include thumbnails in these messages?
I've just found t2W, I've been trading for many years, mainly in a busy dealing room, but for the past few years I've been stuck out in the middle of no where and am missing other peoples' views, input etc
Ftse Sep seems to be stuck in a sideways channel, with prices currently just off the horizontal support level @4485, but a move up through 4525 would look encouraging. For the moment I'm trading the range, buying 4490's, with stops below 4480's, with a target of 4520+. I'd be interested in any of your views for the short term
TaW
PS how do you include thumbnails in these messages?
Attachments
Last edited:
trade-at-will
Newbie
- Messages
- 6
- Likes
- 0
Thanks for that Mullymully said:Posting attachments is achieved by looking under 'Additional options' as part of the "reply to thread" option.
Use "Manage Attachments" and follow the instructions.
TaW
trade-at-will
Newbie
- Messages
- 6
- Likes
- 0
bracke said:trade-at-will
You are looking for a target of 4520 but from your chart next resistance is 4514. and appears reluctant to cross it.
Regards
bracke
Yes, I'm looking for the top line to be rechallenged around 4520, I agree there is intermediate resistance at 4514, but as Mully points out the 1:30 sell-off is underway and that may puncture my circa 4480 stop before we see the rebound.
trade-at-will
Newbie
- Messages
- 6
- Likes
- 0
Yes, trading Sep Futures and had already bought before the 1:30 dip with stops around the 80'sbracke said:trade-at-will
Are you trading the ftse September future?
Bearing in mind your thoughts of a rise to 4520 would not the 1.30 drop provide you with a buying opportunity particularly with this mornings gap to fill?
Regards
bracke
rgds
FTSE250 vs FTSE100
I thought it was time to highlight the difference in performances between the FTSE250 and its bigger brother.
You all know my distrust of the FTSE100 in displaying consistent clear trends.
It is all the problem of a few global titans dominating the index.
This time Vodafone is holding back the index.
(I have nothing against individual stocks doing their own thing.
However when it accounts for nearly 8% of the index, it can materially impact/distort the index.)
Since the FTSE100 bottomed on the 17 May,
it has risen a huge 1.49%
compared to 4.76% for the FTSE250.
Over the same period, Vodafone has fallen 8.60%
Attachments
mully
Are you of the mind that if Vodaphone returns to reasonable health and none of the other large globals go sick we could see a 3% rise in the ftse? All things being equal, which they rarely are.
I note that yesterdays opening gap was virtually filled to-day, and that there was a 10 point opening gap this morning.
Regards
bracke
Similar threads
- Replies
- 1
- Views
- 1K