FTSE100- June

mully

Established member
Messages
967
Likes
3
Another month ended, and now a new month ahead with hopefully new opportunities.

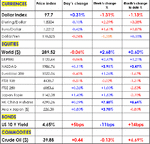
May was not a very fruitful month for equity traders, especially after the first week, with the FTSE100 ranged bound. Rising interest rates (+14bps) and oil prices (+6.7%) remained the dominant negative influences on equity markets. (see the table)
 

Attachments

  • table.gif
    table.gif
    14 KB · Views: 455
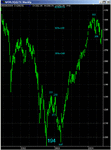
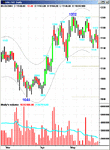
Looking at the bigger picture first, global equity markets have been in retreat/consolidation mode since the last week in January. (See chart 1).

IMHO the big question is whether the correction is now complete, as of last Monday, or whether the recent rally is just part of an ongoing bigger correction. Seasonally, equity markets have entered a less than favourable period.

Looking at the Global Index ($) there is a case for identifying a possible completion of an ABC pattern. The FTSE250 appears to be copying this pattern.

However, looking at the FTSE100, from 23/04/04 (4602) there is the possibility of a 5 wave count to17/05/04. This would suggest that the move since then is merely a rally prior to a further fall.
 

Attachments

  • chart3.gif
    chart3.gif
    17.8 KB · Views: 459
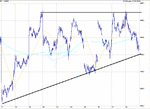
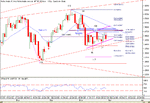
A more detailed look at the FTSE100 suggests that there is a barrier around 4470/2. This has held the FTSE100 four times (potentially bearish). This remains the significant near term hurdle for the bulls to overcome. However, it also possible to identify an ascending triangle, with a series of rising lows. (potentially bullish) However, a break of 4415 would invalidate the rising low theorem.
 

Attachments

  • chart.gif
    chart.gif
    24.4 KB · Views: 443
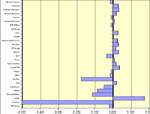
I still remain nervous of reading too much into FTSE100 patterns, given the distortions that a few of the global titans can have on the index. Last week’s fall in Vodafone, on the back of their results, amounted to a fall of 0.5% in the FTSE100.

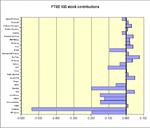
Chart 1 shows last week's stock contributions.
Chart2 shows last month's stock contributions.


What the charts clearly show is the dominant effect the global titans have on the FTSE100 and, as a consequence, what modest impact the rest of the stocks have.


A clear view on the near term prospects of BP, Vodafone, HSBC and GSK should be helpful in determining FTSE's own prospects.
 

Attachments

  • chart1.gif
    chart1.gif
    10.8 KB · Views: 433
  • chart2.gif
    chart2.gif
    11.9 KB · Views: 402
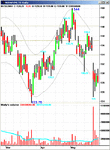
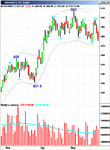
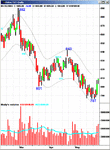
Charts of FTSE Global Titans

Here are the respective charts for
Vodafone
BP
HSBC
GlaxoSmithKline


The cyan line over volume is the 20 day average.
 

Attachments

  • chart.gif
    chart.gif
    22.9 KB · Views: 498
  • chart1.gif
    chart1.gif
    21.4 KB · Views: 409
  • chart2.gif
    chart2.gif
    22 KB · Views: 428
  • chart3.gif
    chart3.gif
    23.3 KB · Views: 431
Last edited:
Final thought before I close off,

The major focus will probably be the US non-farm payroll numbers on Friday.

On the corporate front i think Intel is due to give an update on trading


Good night all. I hope you all had a relaxing Bank Holiday.

Down here in the Cotswolds we have had a glorious sunny day.
 
Greetings All,
Daily chart of FTSE attached.
Little change since last weeks post except more sideways action in price.
Is it a bear flag or a base pattern before another leg higher?
Considerable overhead resistance at 4470ish with the index bouncing off it a couple of times now. Note the 50% retracement from the April 23 high -May 17 low is at 4482 ish. Also, swing low resistance (April 30) of 4490ish.
This combined with the psychological level of 4500 and 61.8% fib ret of 4510 may dampen any advance. ( along with the price of Oil) I'll be looking for at least 2 closes above these levels before getting excited about retesting the old highs of May 5th and Apr 23.
A downside break of 4400 could see a bit of panic and momentum develop even if it is only from the perception of breaking out of a flag. Any 2 closes below 4400 could signal a test of the Mar 24 swing low. (IMO if that lets go--baring a break and recover-- a bear trend / sideways pattern will unfold)
Having said that with the market essentially going no where for almost 3 weeks a break either way will most likely be a fast move.
Comments/ Criticism ??
KJ
 

Attachments

  • Ftse Mon.gif
    Ftse Mon.gif
    23.6 KB · Views: 487
june ftse 100
Morning Mully,& KJH
Mully has done a lot of homework last night June futures expires on 18th. June

John Joachim
 
Morning All,
Looks like Mully was busy yesterday.
Anyone having problems with D4F ?

Iain
PS Ignore the last line i've just got in.
 
mornin' all

Just to add to Mully's mine of information. My swing charts show 3 of his global titans in intermediate downtrend and 1 in uptrend. GSK has only recently breached a swinglow to change to downtrend and it's yet to be confirmed.

Of the ftse14: 7 in downtrend 4 in uptrend and 3???

Ftse itself is in downtrend and needs a break of 472 then a confirming break of 602 to change.
 
Last edited:
Thank you mully for your opening posts.

As shown in the post 3 chart ftse has hit resistance at approx 4470 several times. My understanding is that this may be bearish but if resistance or support is hit often, if/when the break occurs it is a large one.

Ftse has been down to 4411 today but appears to have support at this level.

The first trading day of the month in 2003 and 2004 has usually been a plus day but unless the usa can provide a shot in the arm I am doubtful it will be the case today. ( see thread FTSE 100- MAY ) post 46

Regards

bracke
 
Last edited:
A dearth of posts today

Is that a reflection of the ftse, holiday hangover or can't be bothered.

Maybe the usa will liven things up.

Regards

bracke
 
two of us awake bracke!!

don't know if it's just me but the site has been working really slowly at times today
 
Half term, narrow range, poor volume and kids online for a slow internet? :rolleyes:
 
Yes indeed....is it bedtime yet.

It appeared to start going slow last week, not causing me much trouble.

Is it a reflection of the number of members that this site now has.

ftse moving up a little in response to the usa I imagine but will it finish in positive territory and record another plus day for the first day of the trading month?

Regards

bracke
 
hi oatman - it's not that infamous dow 10am reversal kicking in again is it?
 
Where has everyone gone?

Is there somethimg you are not telling me?

Birthdays, holidays or is it that you are all busy trading?

Another gap this morning, yes I know I keep on about them but it may illicit a response from someone.

Regards

bracke
 
Not a lot one can do at the moment. FTSE now be-calmed and will probably now wait for the US. So off to get plants for my hanging baskets!

Jean
 
JeanM

Come back! Come back!

Can not accept becalmed. Approx 15 point gap this morning and further rise to 4457, a current rise on the day of 35 points.

Will it remain at this level for another 3 hours? Possible but would not count on it. ( it did ! )

Remember there is still that gap to close.

Regards

bracke
 
Last edited:
Still here. Just having a last look before I go. Have been very tempted to go short, but caught too many times in the past. Prefer to wait and go for a short later when we see what the US is going to do. My bet is still that we won't do much until this afternoon.

Jean
 
Top